Python for Excel Analysts
Be a part of the data-driven future
In case you haven’t heard the news, Microsoft released a new feature for running Python code inside Excel. This is a game changer for professionals who want to have more impact at work using data!
Dave on Data is proud to partner with Anaconda, the world’s most popular Python platform, to provide training resources for professionals interested in getting started with Python.
BTW - If you were curious, Python formulas in Excel run behind the scenes on Anaconda in the Azure cloud.
Just Announced - If you like what you see in the blog series, I will teach my Anaconda-certified Data Analysis with Python in Excel course from December 11-15.
Blog Series

Part 1 - The Basics
This is the first post in a five-part blog series that introduces you to the most fundamental Python formula skill - working with data tables.

Part 2 - Working with Columns
This is the second post in the five-part blog series that builds upon the knowledge you gained in Part 1 to start working with columns of data using Python formulas.

Part 3 - Filtering Tables
In the third post of this five-part blog series, you will learn a critical skill when working with data - how to filter tables using Python formulas.

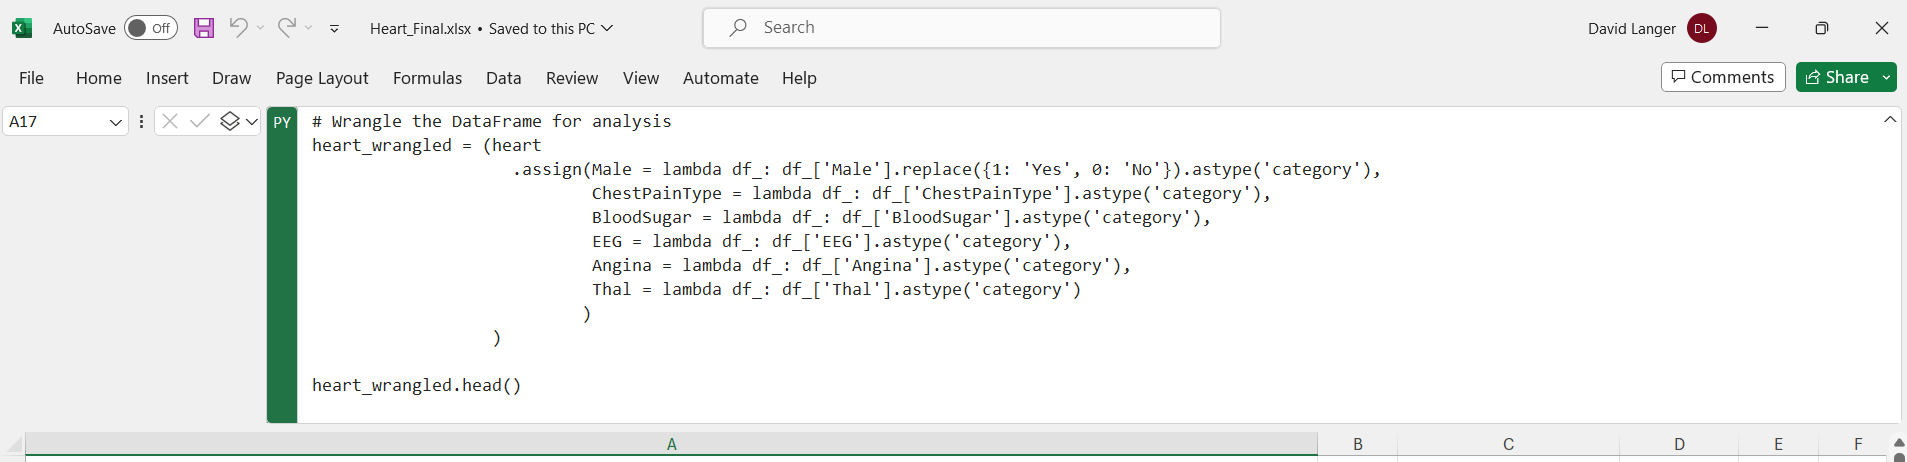
Part 4 - Data Cleaning and Wrangling
In the fourth post, you will be introduced to crafting the best data for your analyses using Python code.

Part 5 - Combining Tables
In the fifth and final post, you will use your skills with Excel functions like VLOOKUP() to learn how to join data tables using Python.