
Join 1,000s of professionals who are building real-world skills for better forecasts with Microsoft Excel.
Issue #58 - Text Mining with Python Part 5:
Building a Spam Filter
This Week’s Tutorial
If you're new to this tutorial series, be sure to check out last week's tutorial to get up to speed on the dataset.
Once again, this week's tutorial uses real-world data from Kaggle's Sarcastic Headlines dataset. You will learn how to build a particular kind of predictive model used in text mining known as a spam filter.
Specifically, I will be using data from the SarcasticHeadlines.xslx Excel workbook available from the newsletter's GitHub repository. As always, it is highly recommended that you follow along and write all the code.
NOTE - This tutorial will use a real-world dataset. It contains "adult language" and political satire. You've been warned!
The Scenario
Let's say that you really enjoy sarcastic headlines and like to read them during breakfast to start your day with a laugh. So, not surprisingly, you want to be able to evaluate new headlines and only read those that are sarcastic.
One way to accomplish this is to build a type of predictive model known as a spam filter. Spam filters were originally built for separating legitimate emails (i.e., ham) from illegitimate emails (i.e., spam).
Over time, because they're wildly useful, spam filters were applied to other scenarios, like SMS messages on your mobile phone.
Think of a spam filter as a way of taking any sort of textual document (e.g., a headline) and then predicting if it is one of two classes. In the case of the sarcastic headlines dataset:
The ham (i.e., the stuff you want to keep) will be sarcastic headlines.
The spam will be legitimate headlines.
In this tutorial, you will learn to build a simple, but surprisingly effective, spam filter for the sarcastic headlines dataset. The skills you will learn in this tutorial are applicable to many other real-world scenarios.
The Pipeline
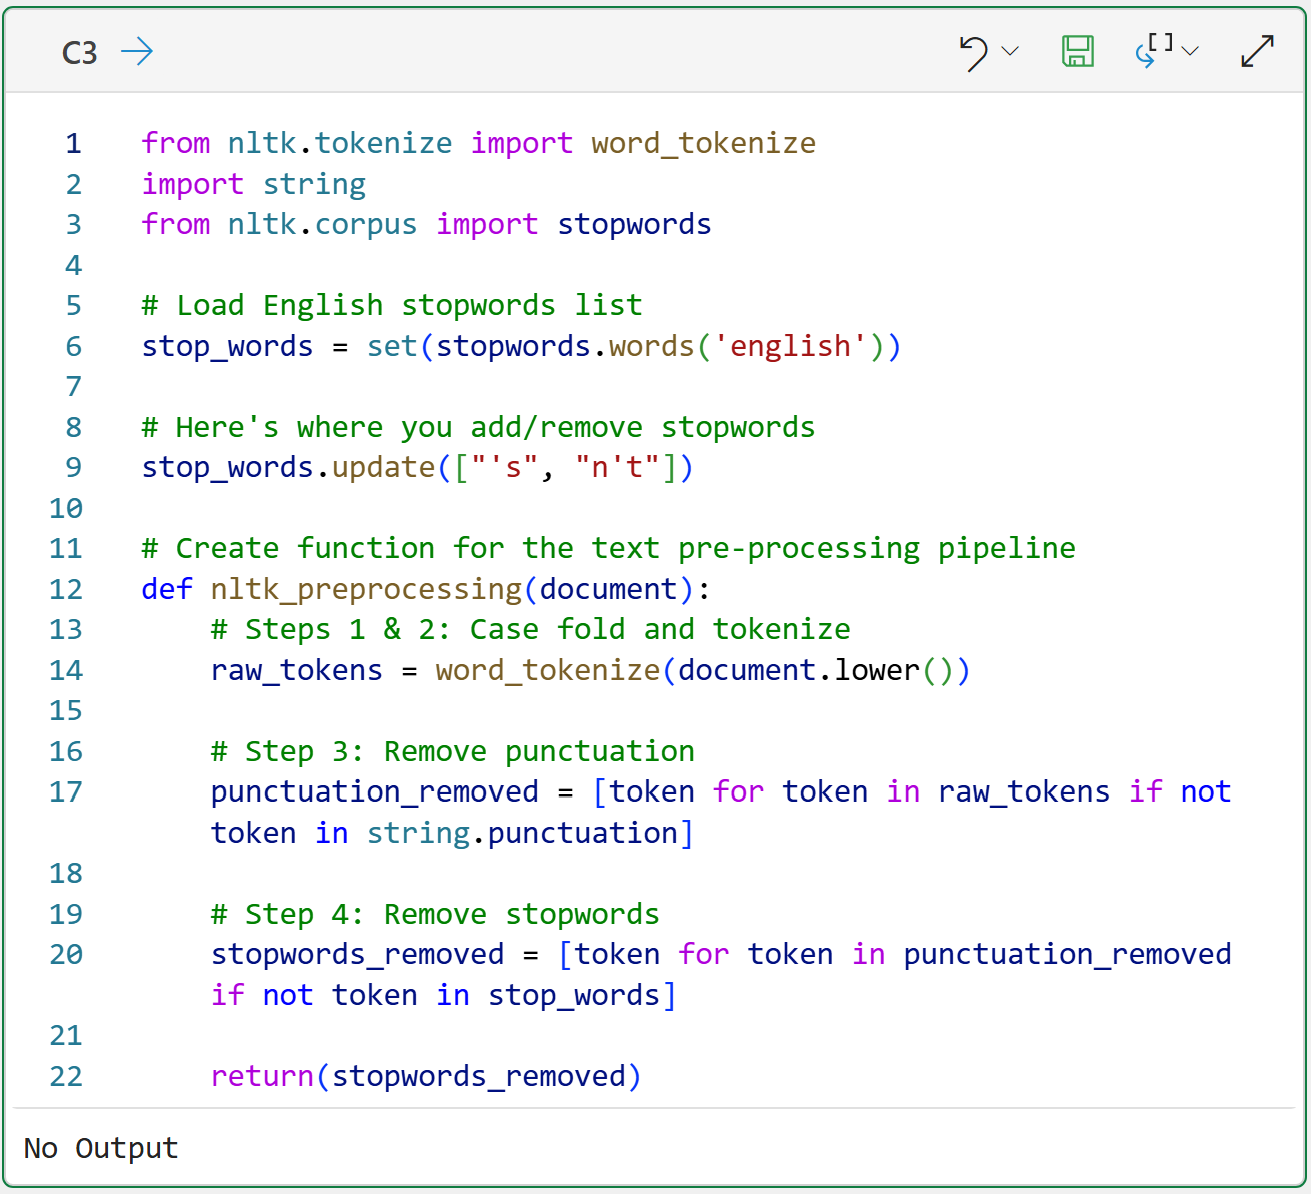
As covered in Part 3 of this tutorial series, a standard part of any text mining project is setting up the text preprocessing pipeline.
I won't cover the following code in detail for brevity. If you're new to this tutorial series, be sure to check out previous tutorials for detailed explanations.
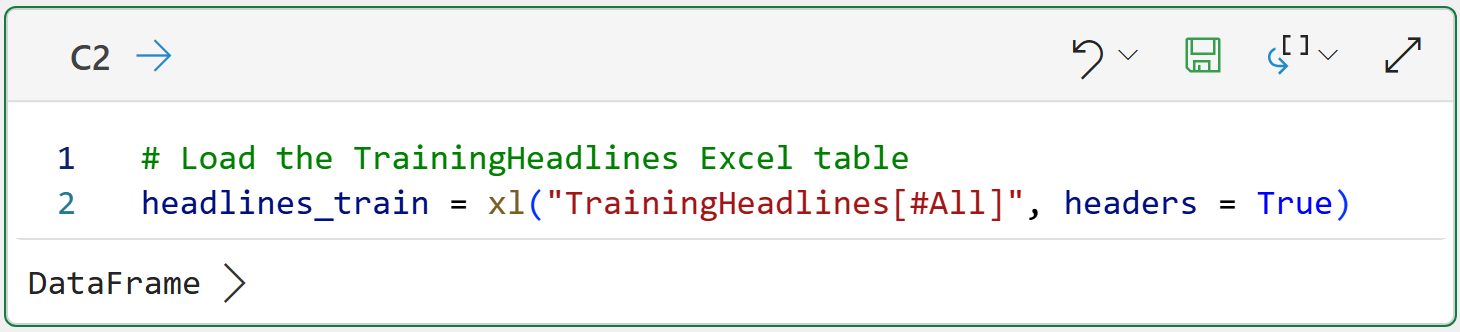
Per my usual, I highly recommend you store all your Python formulas in a single worksheet and organize them vertically, including documentation:
Then, place each Python in Excel formula to the right of your step-by-step documentation:
BTW - If you're new to Python in Excel, my Python in Excel Accelerator online course will teach you the foundation you need for analytics fast.
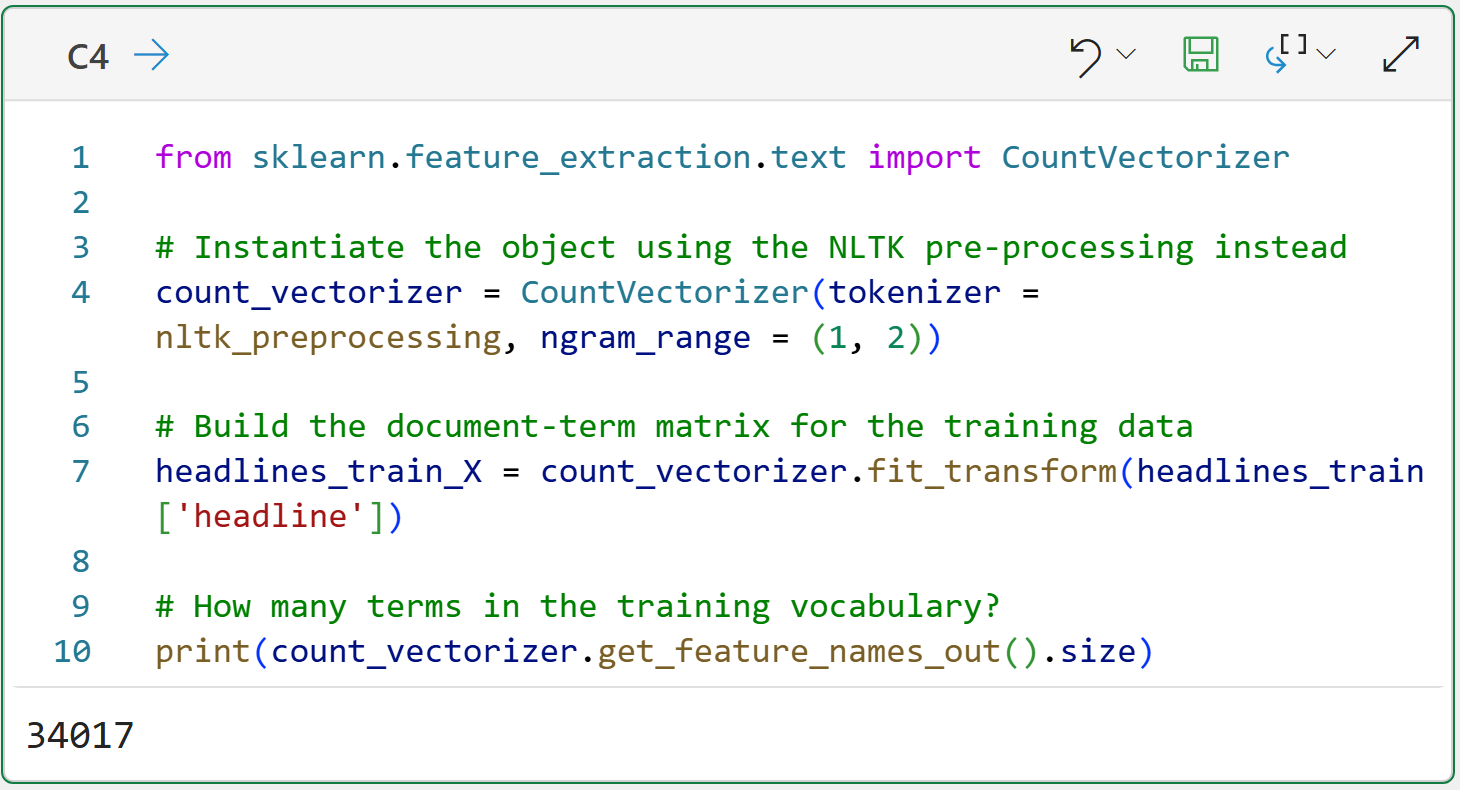
The Python code on line 4 of cell C4 is doing something new that I wanted to mention.
The ngram_range = (1, 2) parameter tells the CountVectorizer to create both unigrams and bigrams for the document-term matrix. As covered in Part 2 of the tutorial series, bigrams can be useful for adding more information to your text mining.
In this tutorial, adding bigrams slightly improves the spam filter's accuracy in predicting sarcastic vs. legitimate headlines.
Using bigrams also increases the number of terms (i.e., columns) in the matrix by more than 3x from 10,441 for just unigrams to a total of 34,017 unigrams and bigrams!
This is totally expected in text analytics, BTW.
Training the Model
All predictive models, including spam filters, basically operate the same way:
They learn patterns from historical data that are highly predictive for an outcome of interest (e.g., approve/deny, fraud/not fraud, ham/spam, etc.).
Learning these patterns is known as training the model, and the data used to train the model is known as the training dataset.
A trained model can be used to make predictions on new data (e.g., a new batch of headlines arriving on a Monday morning).
There are many kinds of predictive models available using Python in Excel. Not all of these models are useful for building spam filters, so this tutorial will use a Naive Bayes model. While relatively simple, Naive Bayes models have been successfully used in building real-world spam filters for many years.
I won't go into the details of how Naive Bayes models learn from data. At a high level, these models work by learning the relative probabilities of which tokens are more common in ham vs. spam. For example, maybe the token aliens are far more likely to appear in sarcastic headlines than in legitimate headlines.
The following code trains a Naive Bayes model using the document-term matrix and the is_sarcastic indicator (i.e., what is often called the label):
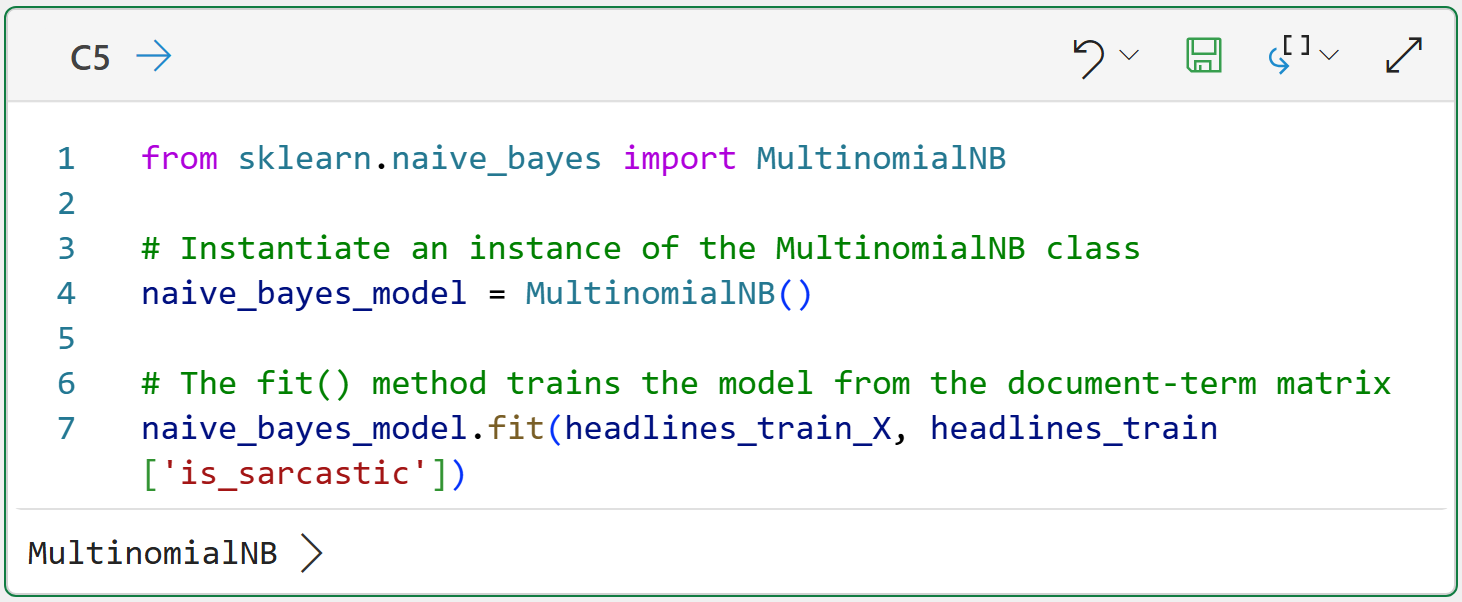
The magic happens in line 7 of cell C5. You can think of calling the fit() method as telling the Naive Bayes model, "Hey! I've got all this text data goodness. Go learn what you can from it to accurately predict the is_sarcastic label."
Think about this for a second.
If you don't count the comments, there are only 3 lines of code in cell C5. That's all you need to train a spam filter. Now, compare 3 lines of code to all the code required to produce the document-term matrix.
This is a universal pattern in real-world data science and analytics. You spend far more time working with the data compared to modeling.
Preparing the Test Data
In this hypothetical scenario, we're looking for a spam filter that can accurately predict (i.e., classify) if a headline is sarcastic or not. The idea being that each morning, the spam filter would serve up only sarcastic headlines to make you laugh over breakfast.
However, you've got a problem.
The Naive Bayes model has been trained on historical data, but you have no idea how well it will perform in the future. This is where testing comes into play. Before you rely on the spam filter to make you laugh, you need to test that it works.
Since you don't have a TARDIS (i.e., a time machine), you can't travel into the future to collect future headlines to use with the model. Instead, you reserve some of the historical data for testing purposes.
This data is often referred to as the test holdout set because the model isn't trained on it. Since the model's never seen the test data, you can think of it as simulating the future.
The SarcasticHeadlines.xslx workbook contains the TestHeadlines table, which can be used to test the Naive Bayes model.
The following Python formula loads the TestHeadlines table and creates a document-term matrix for the test headlines:
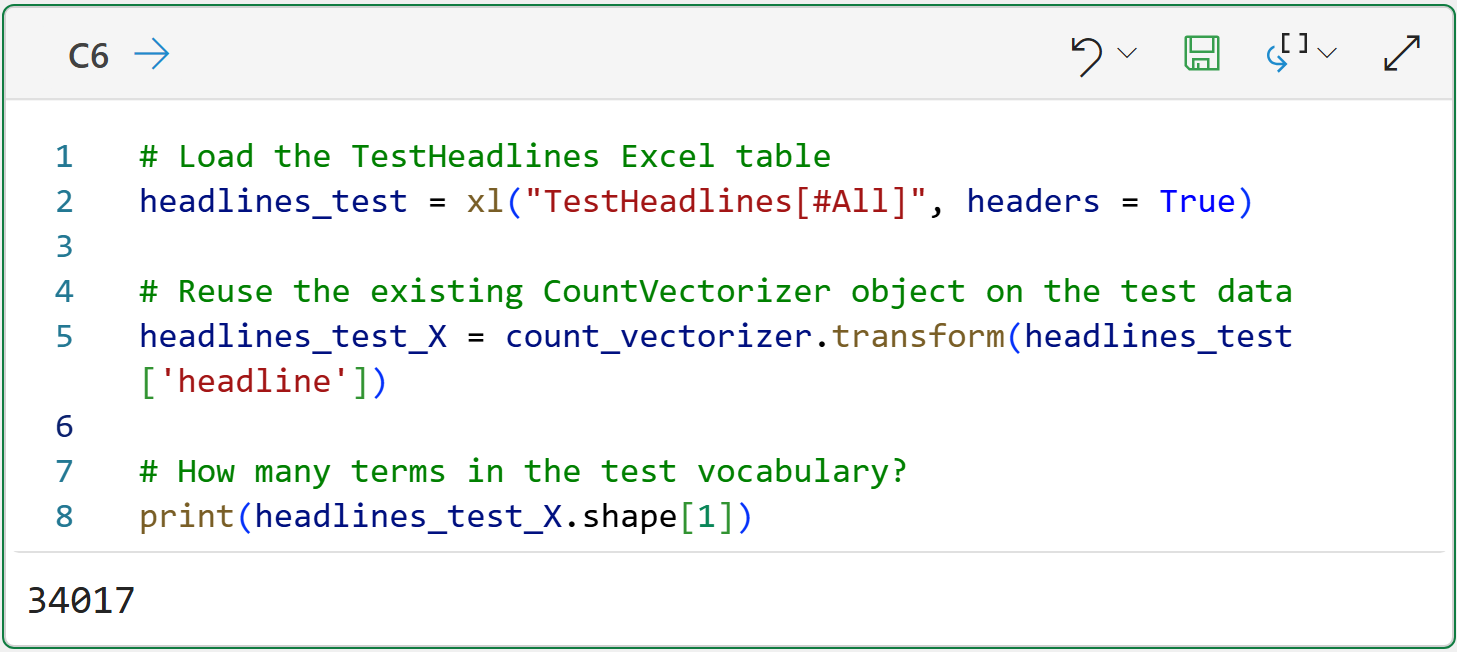
Take a look at line 5 of the code in cell C6. This line of code reuses the existing count_vectorizer object that was initially built using the headlines training data. There's an important reason for this.
Since you never know what words might be used in text documents, there's always the chance that words used in the test dataset do not appear in the training dataset.
Reusing the existing count_vectorizer object avoids this problem because it produces a document-term matrix for the test dataset that contains only the terms present in the training dataset.
The output of cell C6 shows that the number of terms (i.e., columns) of the headlines_test_X matrix matches the training dataset: 34,017.
With the document-term matrix created for the test dataset, it's now time to test the spam filter's accuracy.
Testing the Model
Testing the model's accuracy is a very simple process:
Have the Naive Bayes model make a prediction for each headline in the test dataset.
Compare the model's predictions to the actual label.
Here's the code to make this happen:
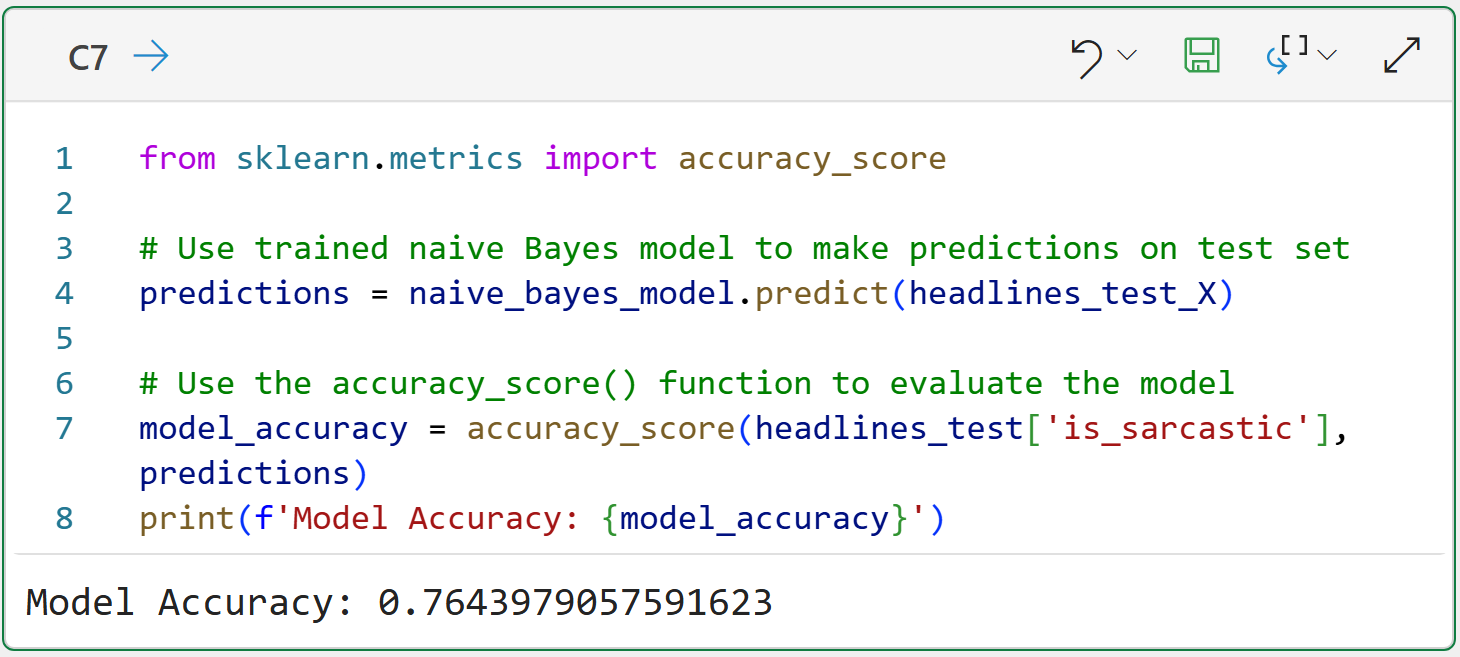
Look at the code on line 4 of cell C7. The code asks the trained Naive Bayes model to make predictions for the headlines_test_X document-term matrix. What is returned is a 1 (i.e., sarcastic) or a 0 (i.e., legit) for each test headline.
The code on line 7 then uses the accuracy_score() function to compare the predictions to the actual labels and calculates how many were predicted correctly.
Based on the output from cell C7, we would assume the spam filter is approximately 76.44% accurate at predicting (i.e., classifying) headlines as sarcastic or legit.
I wouldn't blame you if you are underwhelmed by the spam filter's predictive performance. However, this is only the first pass on building a spam filter. I would encourage you to try out the following to improve the model's accuracy:
As covered in Part 4, look at the word clouds for the training dataset. It's possible you might see words that you might want to add to the stopwords list. You want to add words to the list that are common to both sarcastic and legitimate headlines.
Experiment with adding larger ngrams (e.g., trigrams).
Remember - building useful predictive models (e.g., spam filters) is always an iterative process.
This Week’s Book
There are many real-world business problems that can be addressed with uplift modeling. Examples include:
What is the expected revenue to be generated from a direct mailing?
How can we reduce our customer churn rate?
Will this patient recover if they’re given this medication?
As you might imagine, skills with uplift modeling are useful to any professional and this is a great book to get you started:
This book does contain a non-trivial amount of math. However, you can still get a lot of value from the book in understanding the underlying concepts of uplift modeling.
That's it for this week.
My next newsletter will teach you how to use text mining to build something that is wildly useful in many real-world scenarios - sentiment analysis.
Stay healthy and happy data sleuthing!

Dave Langer
Whenever you're ready, here are 3 ways I can help you:
1 - The future of Microsoft Excel is unleashing the power of do-it-yourself (DIY) analytics using Python in Excel. Do you want to be part of the future? My Python in Excel Accelerator online course will teach you what you need to know, and the Virtual Dave AI tutor is included!
2 - Are you new to data analysis? My Visual Analysis with Python online course will teach you the fundamentals you need - fast. No complex math required, and the Virtual Dave AI Tutor is included!
3 - Cluster Analysis with Python: Most of the world's data is unlabeled and can't be used for predictive models. This is where my self-paced online course teaches you how to extract insights from your unlabeled data. The Virtual Dave AI Tutor is included!