
Join 1,000s of professionals who are building real-world skills for better forecasts with Microsoft Excel.
Issue #57 - Text Mining with Python Part 4:
Mining Real-World Data
This Week’s Tutorial
For brevity, I will not repeat the content from last week's tutorial. If you're new to this tutorial series, be sure to read it first.
This week's tutorial uses real-world data from Kaggle's Sarcastic Headlines dataset. You will learn how to mine the text data and then visualize the results using word clouds.
Specifically, I will use data from SarcasticHeadlines.xslx Excel workbook available from the newsletter's GitHub repository. As always, it is highly recommended that you follow along and write all the code.
NOTE - This tutorial and the next will use this real-world dataset. It contains "adult language" and political satire. You've been warned!
The Dataset
This tutorial will be using the data stored in the TrainingHeadlines table of the workbook:
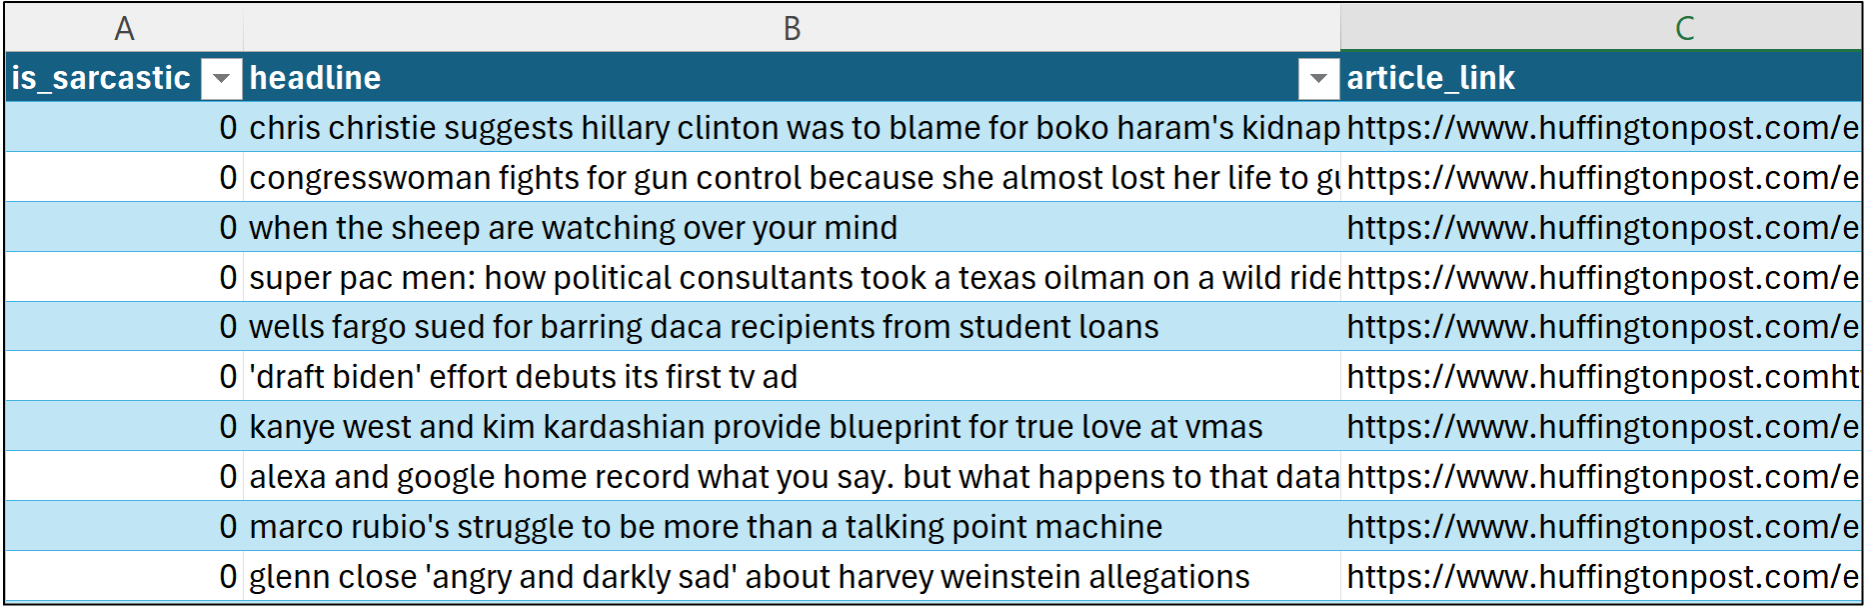
The dataset is a corpus of headlines (i.e., short documents), with some headlines legitimate (e.g., from the Huffington Post) and others sarcastic (e.g., from The Onion). There are some additional features as well:
The is_sarcastic feature is a binary indicator of sarcasm (e.g., 0 is False and 1 is True). I'll use this feature in this tutorial and the next.
The headline feature contains all the headlines (i.e., the corpus). This tutorial and the next will be mining this free-form text data.
The article_link feature contains the URL from which the headline originated. This feature won't be used.
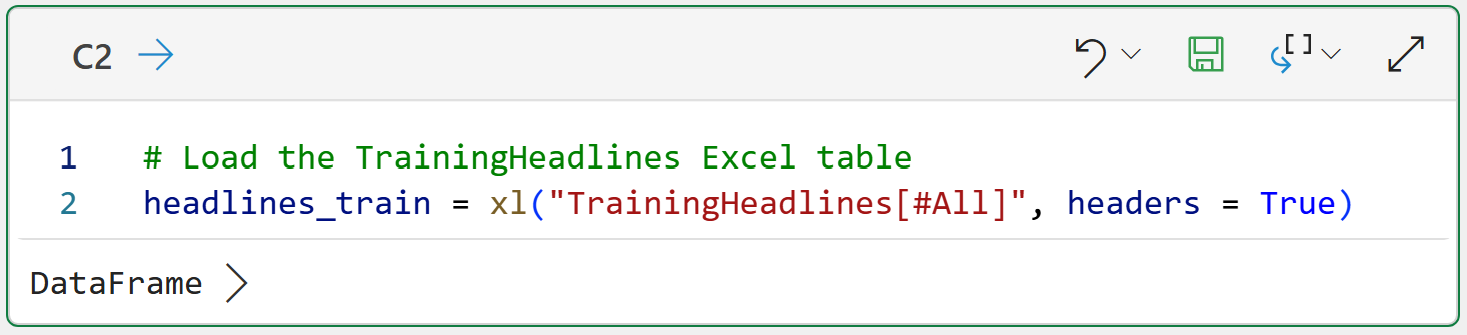
Before the text can be mined, the TrainingHeadlines table must be loaded into Python in Excel. Per my usual, I've set up the workbook with a dedicated Python Code worksheet.
I highly recommend you store all your Python formulas in a single worksheet and organize them vertically, including documentation:
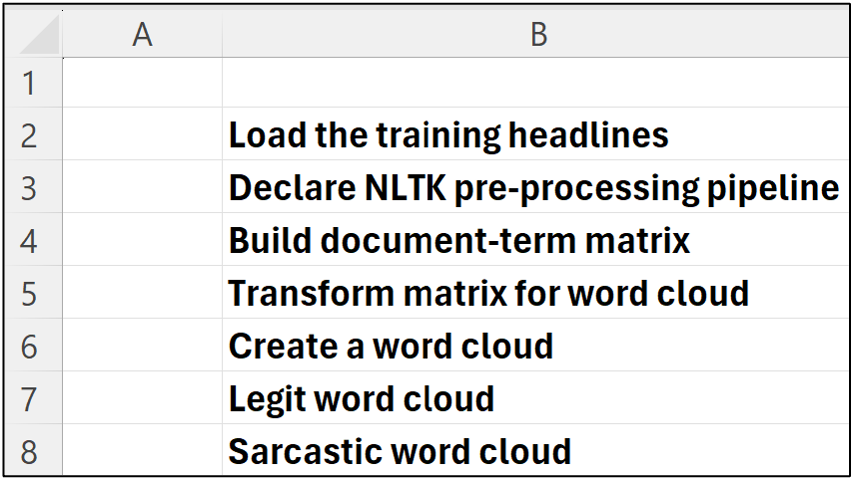
I place my Python formulas to the immediate right of each of the comments pictured above. This organizes the Python formulas in a step-by-step fashion:
With the data loaded into Python in Excel, the next step in mining the headlines is building a document-term matrix.
Document-Term Matrix with scikit-learn
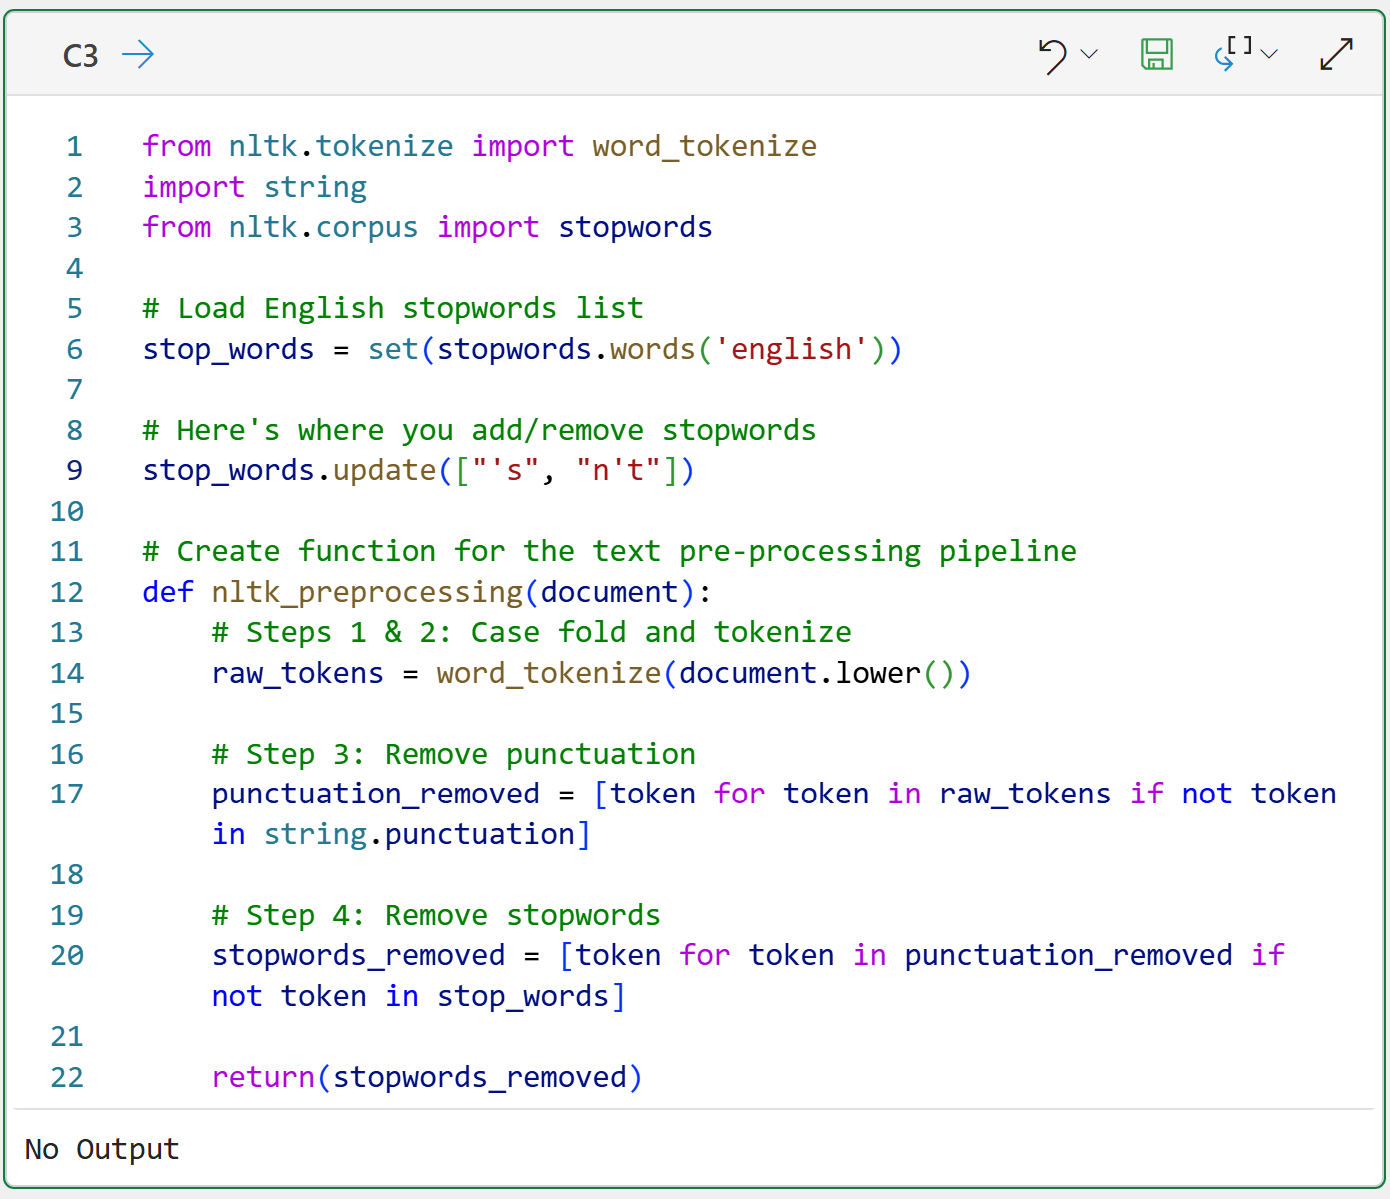
As covered in the last tutorial, it's a good idea to declare a function that implements a Natural Language Toolkit (NLTK)-based text pre-processing pipeline:
BTW - If you're new to Python in Excel, my Python in Excel Accelerator online course will teach you the foundation you need for analytics fast.
The above code has a slight addition compared to last week's tutorial on line 9. The code is adding the tokens 's and n't to the stop words list. If you're curious about why these were added, experiment by commenting out the code on line 9 and see how the word clouds change.
The next step is using the CountVectorizer class from the scikit-learn library to build the document-term matrix using the custom text pre-processing pipeline:
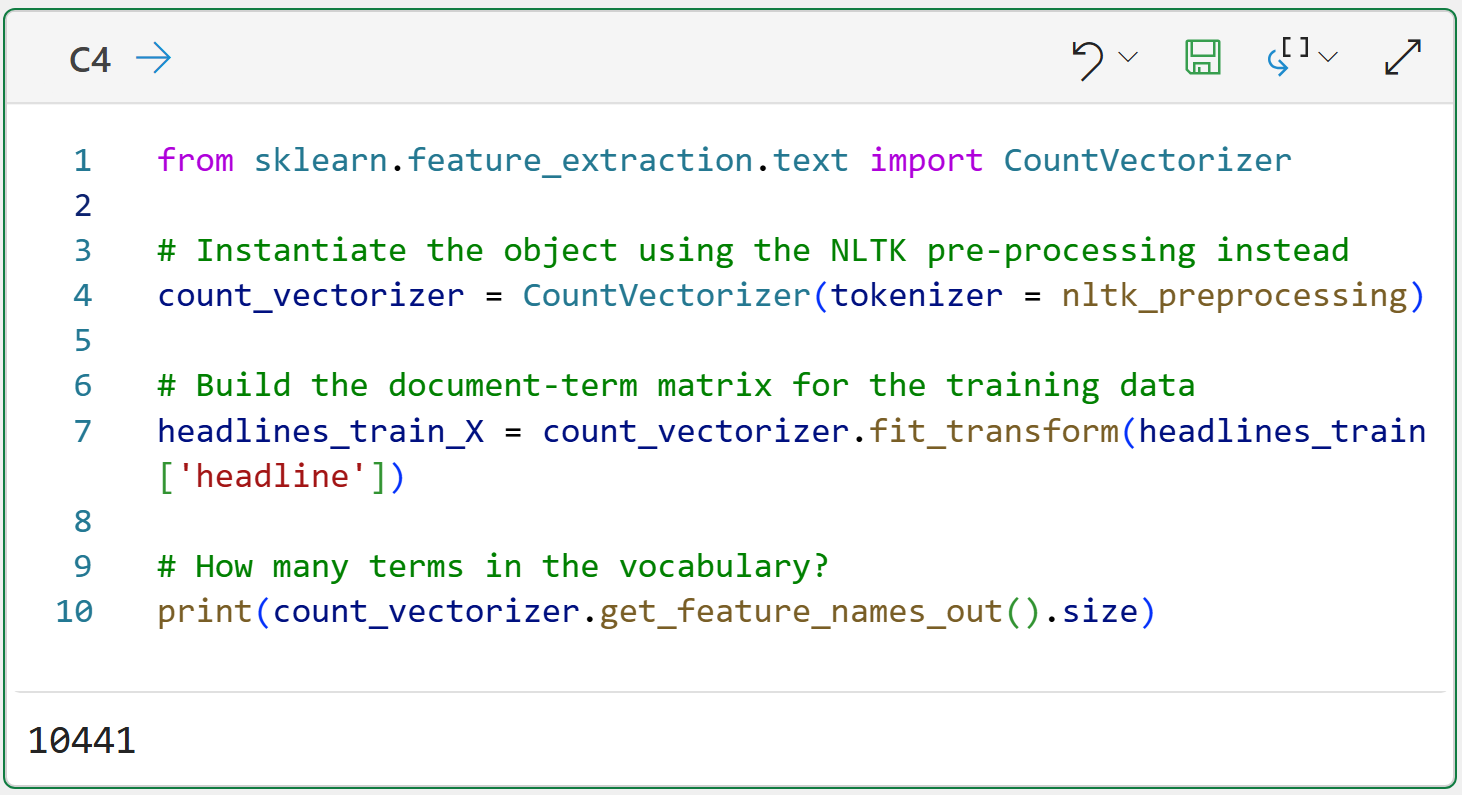
NOTE - Even though I'm using Python in Excel for this tutorial, the Python code is exactly the same whether you use a tool like Jupyter Notebooks. The only Excel-specific code is in cell C2.
Check out cell C4's output. Even though the documents in the corpus are very short, and with punctuation and stopwords removed, there are still 10,441 tokens in the vocabulary!
Also, check out the code on line 7 in cell C4. The code passes the headline column of the headlines_train DataFrame. This column contains 4,005 headlines, and each one will be passed to the nltk_preprocessing() function for tokenization.
I've named the document-term matrix headlines_train_X to follow the commonly-used scikit-learn naming convention. The X in the name denotes that the object contains features that will be used in some form of analysis.
With the document-term matrix built, the next step is to transform the matrix into a format suitable for visualization as a word cloud.
Preparing the Matrix
If you're unfamiliar, a word cloud is a simple way to visualize the tokens in a corpus. Each token is represented in the word cloud, and its size indicates its frequency in the corpus (e.g., more frequent tokens are larger).
In order to build a word cloud, the document-term matrix needs to be transformed so that each token in the vocabulary is associated with the total count of that token across the entire corpus:
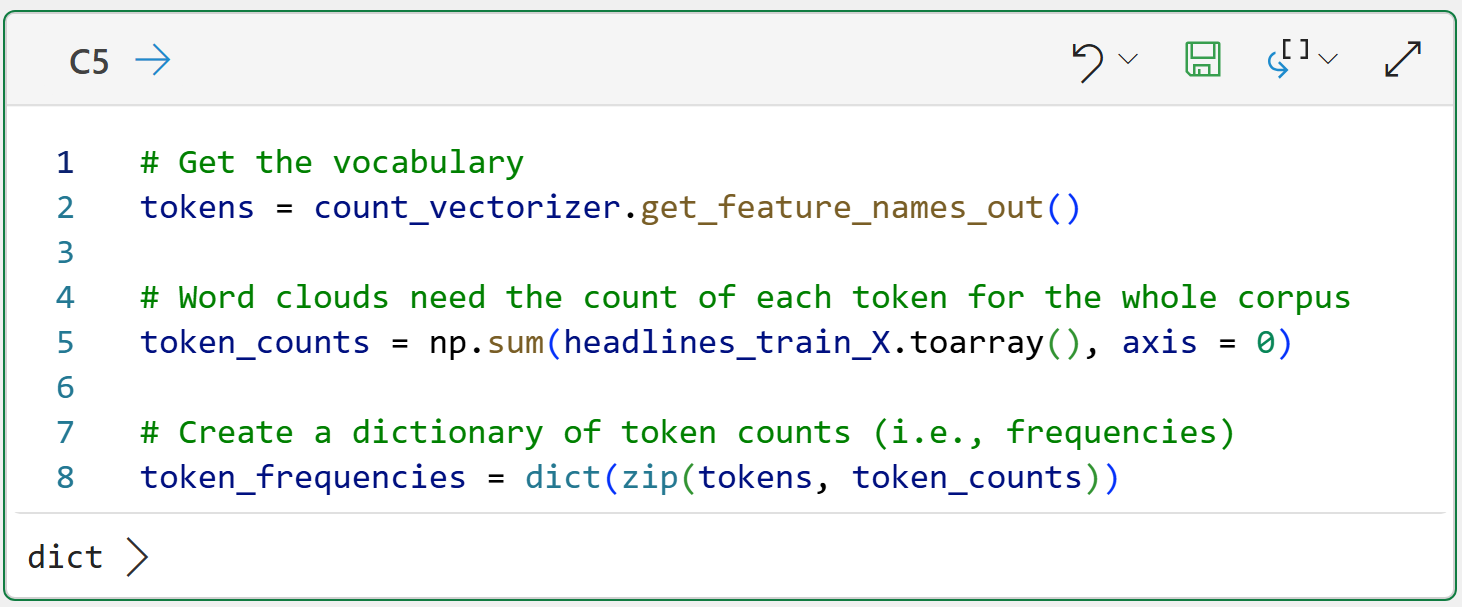
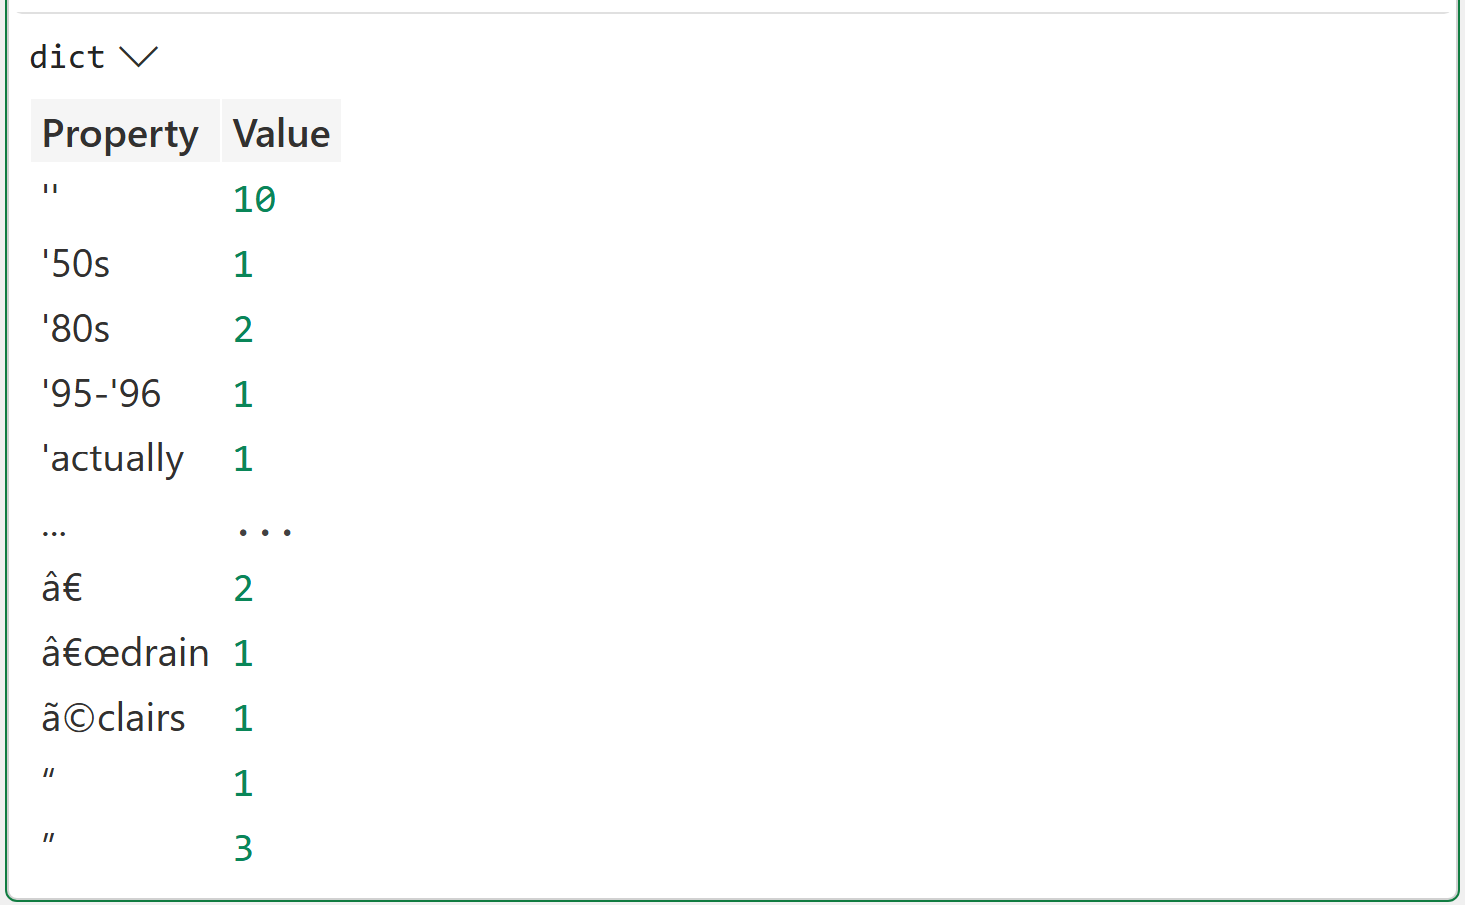
The output of cell C5 illustrates what the code is doing:
Line 2 gets the vocabulary of unique tokens across the corpus.
Line 5 counts how often each token occurs across the entire corpus.
Line 8 creates a Python dictionary to store each token and its associated count.
With the token frequencies calculated, it's time to build a word cloud.
The All-Token Word Cloud
Python in Excel includes the wordcloud library, and it does exactly what you would expect:
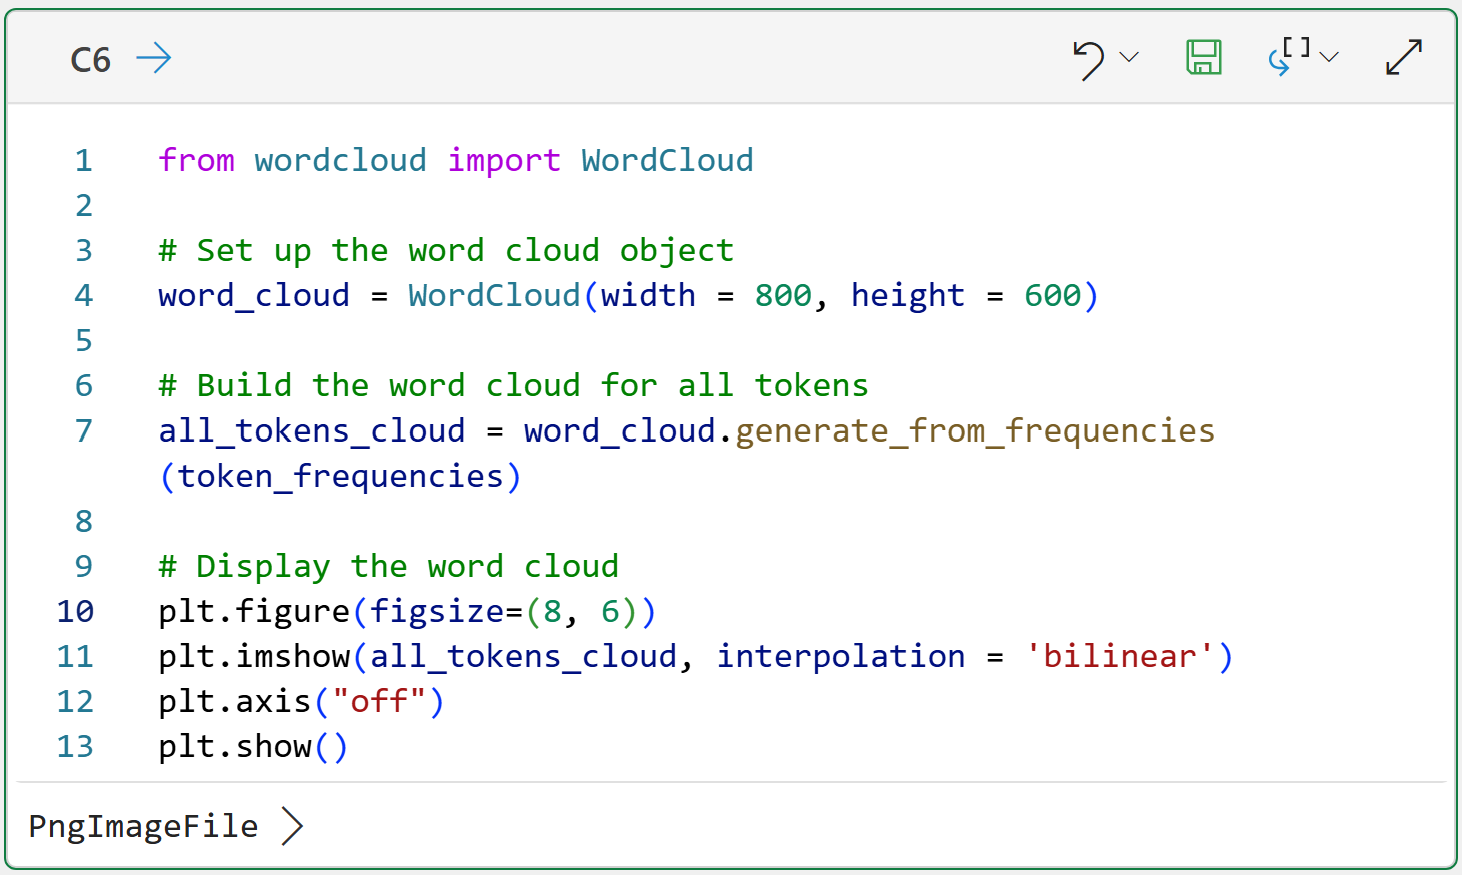
Here's what's going on in cell C6's code:
Line 4 creates a WordCloud object and specifies that the word cloud should be 800 pixels wide and 600 pixels tall.
Line 7 generates the word cloud image using all of the token frequencies for the entire corpus.
Lines 10-13 display the image so that it is 8 inches wide and 6 inches tall and has no axis values for a cleaner result.
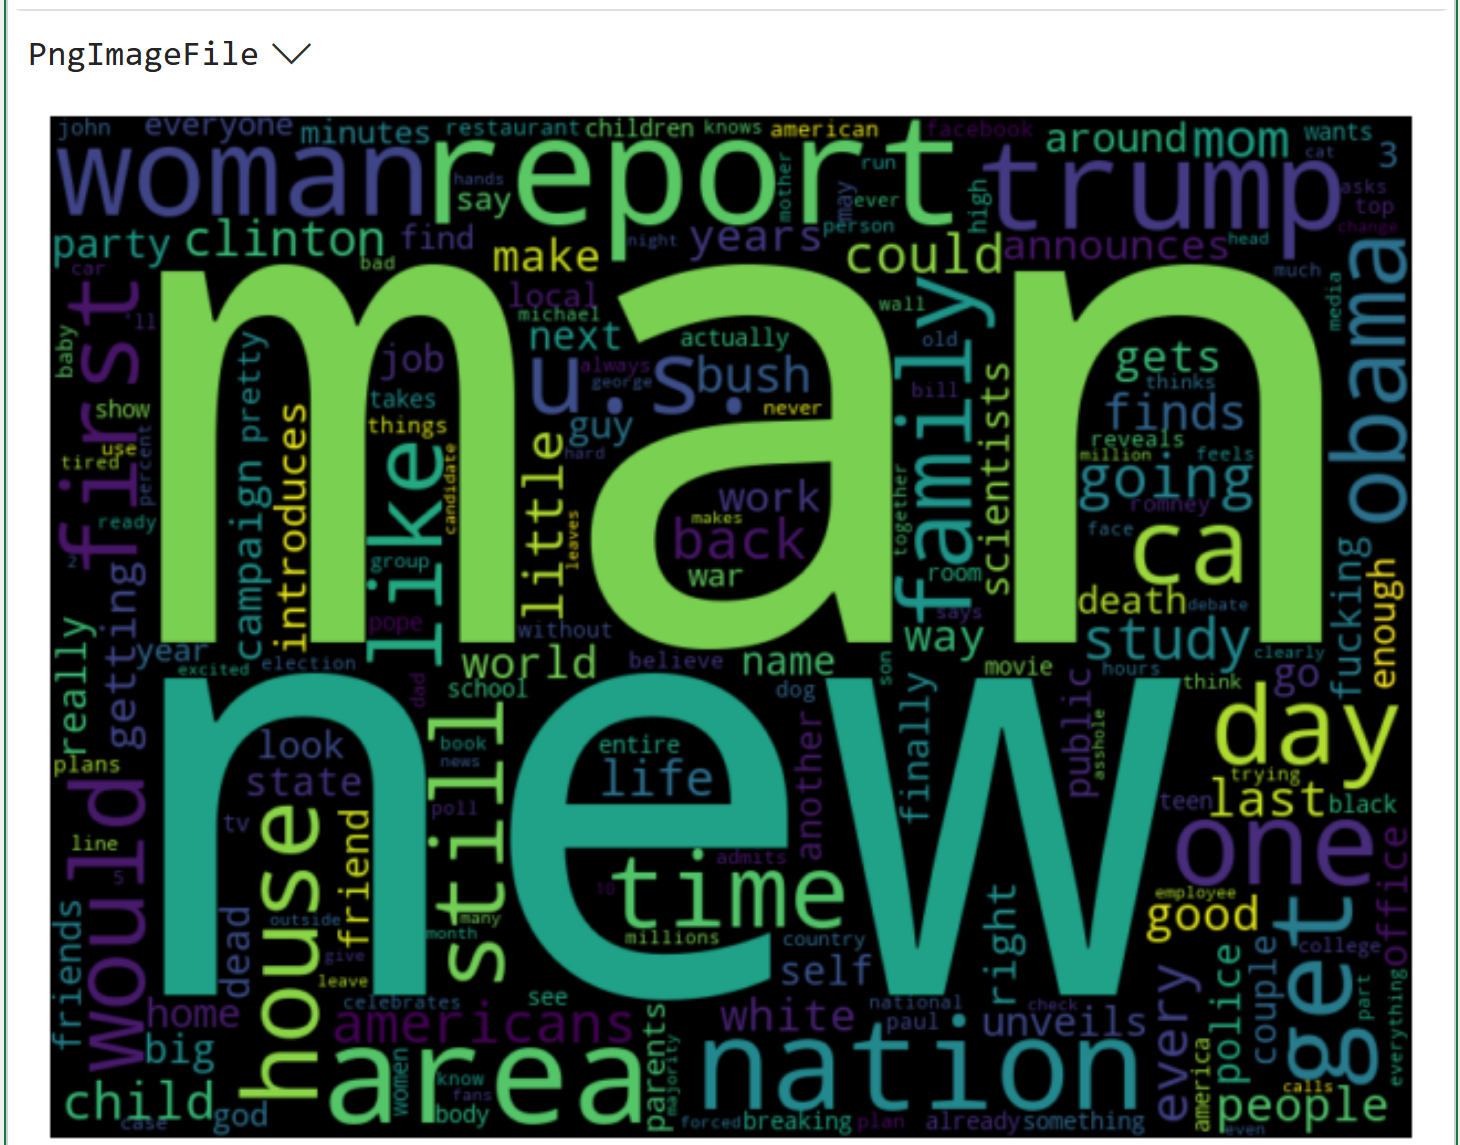
Clicking on PngImageFile > in the output displays the word cloud:
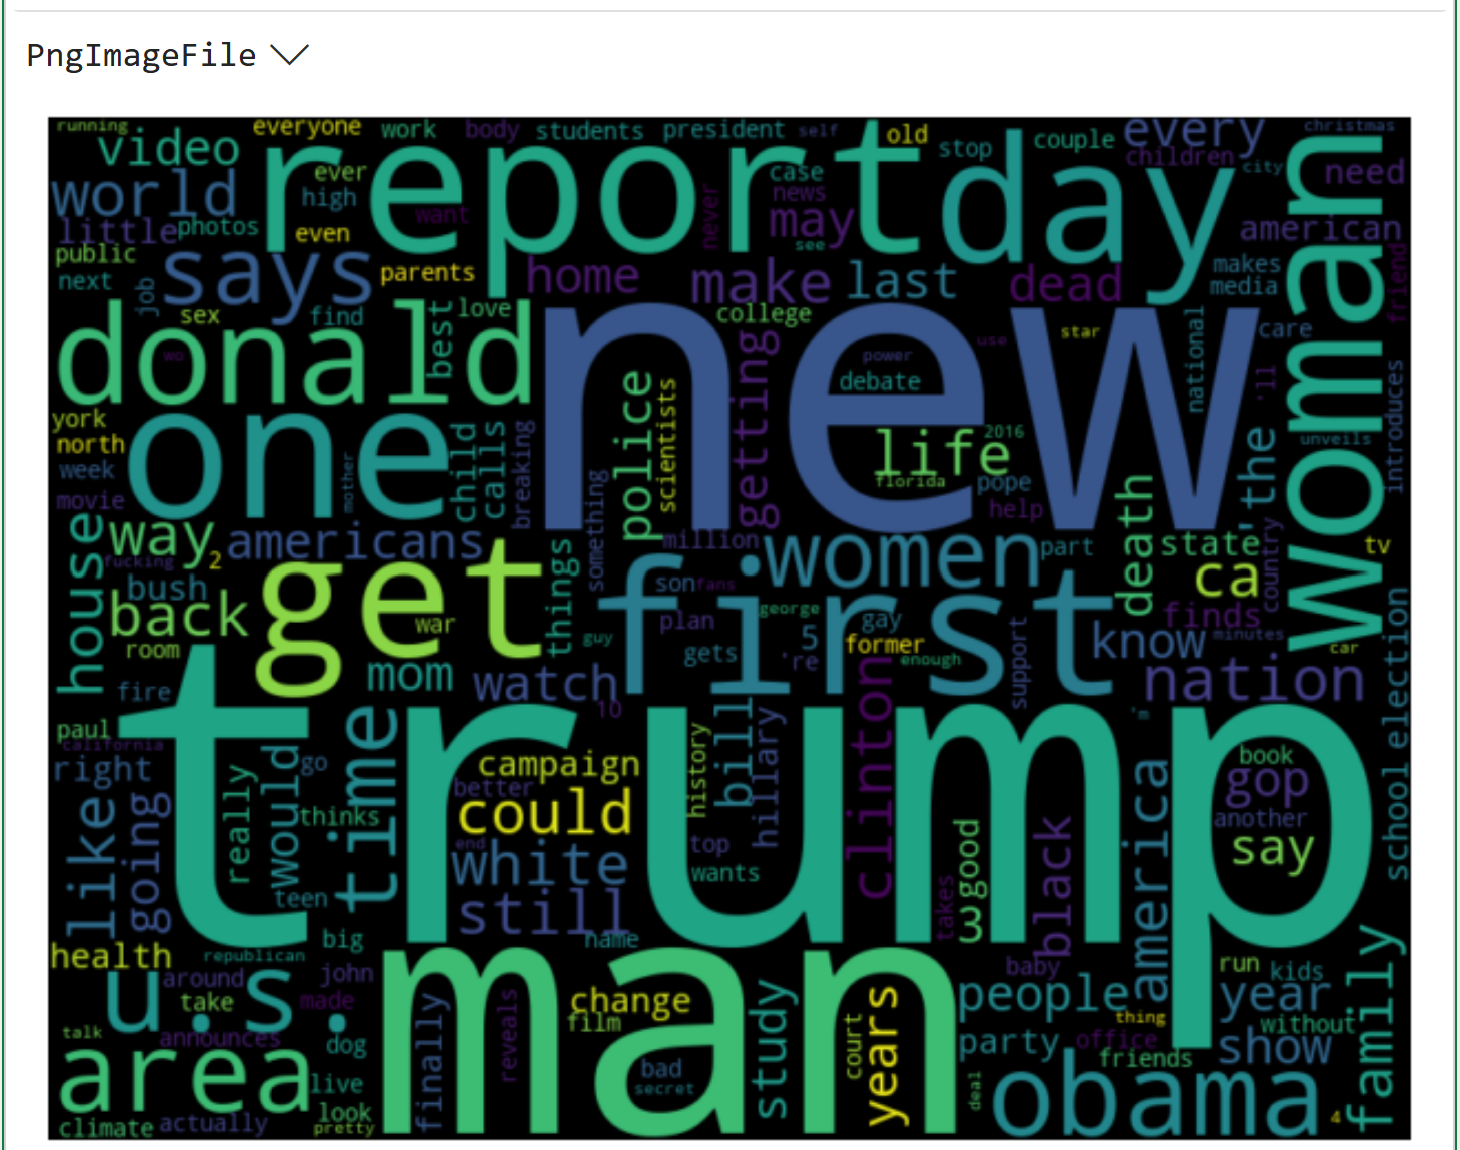
If you're curious about the dataset behind the word cloud above, check out the Kaggle website.
When you look at the above word cloud, keep in mind that it doesn't differentiate between the sarcastic and legitimate headlines.
It's entirely possible that the word clouds might look different if the tokens were separated by legit/sarcastic.
Legit Headlines Word Cloud
The following Python formula subsets the rows of the document-term matrix to legit headlines in the dataset:
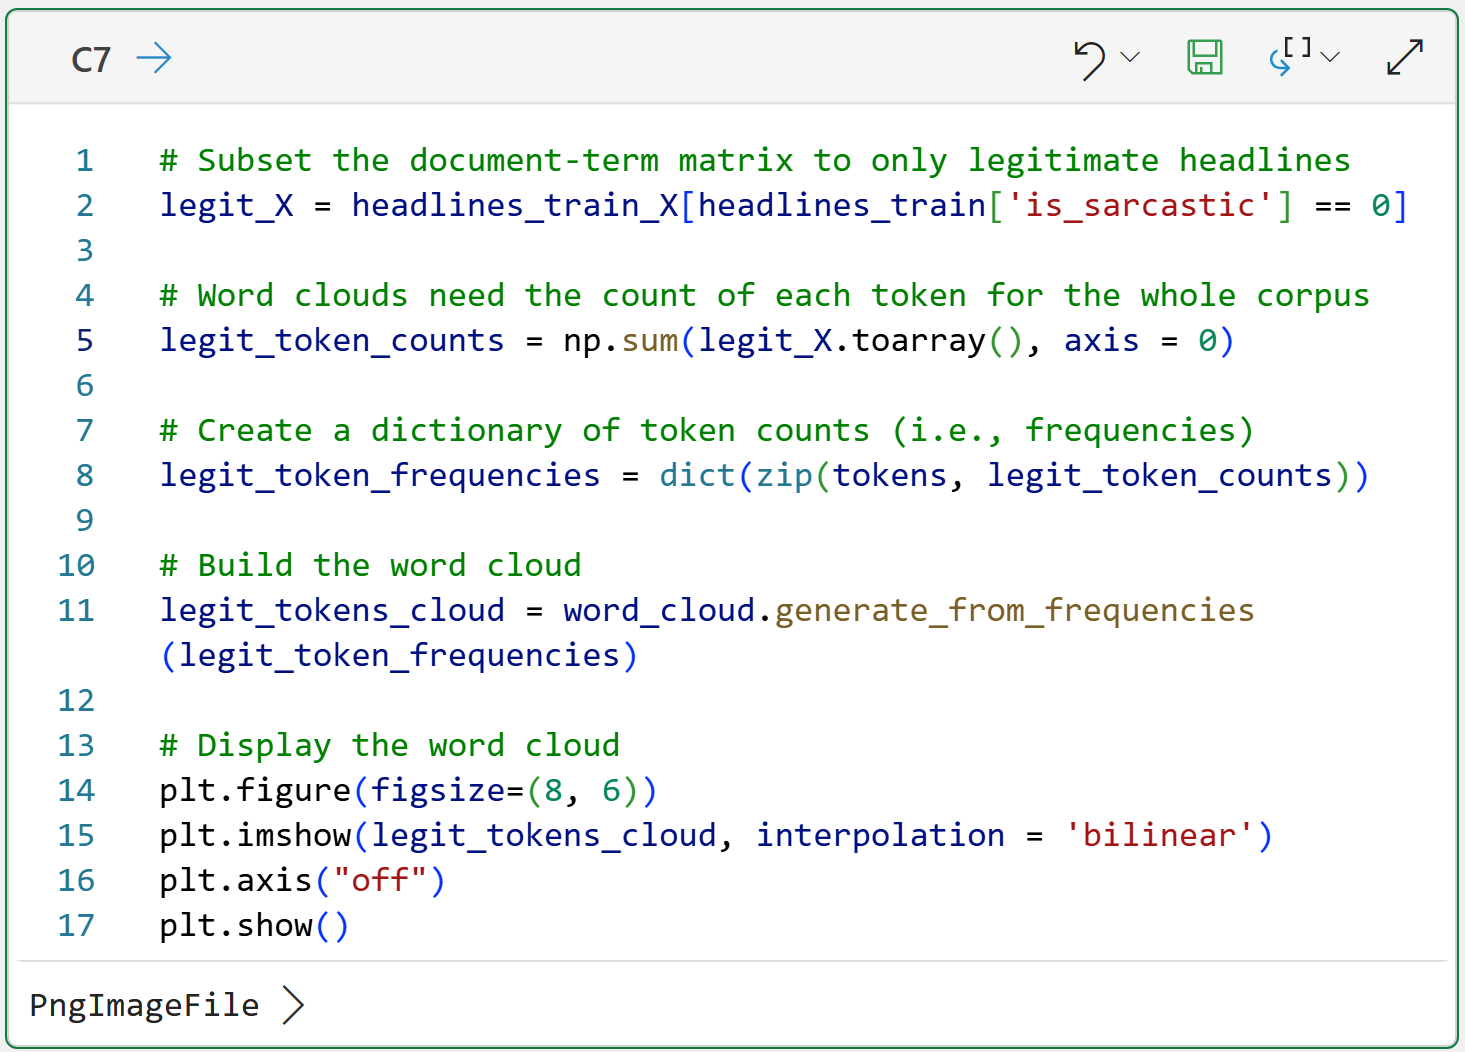
The magic in the code above happens on line 2 with headlines_train['is_sarcastic'] == 0. This code creates what is known in Python as a mask.
Think of a mask as a collection of True and False values that filter the data. In this case, the mask will be True where is_sarcastic == 0 and False otherwise. Only rows in the document-term matrix (i.e., headlines_train_X) with True values will be returned.
And here's the legit headline word cloud:
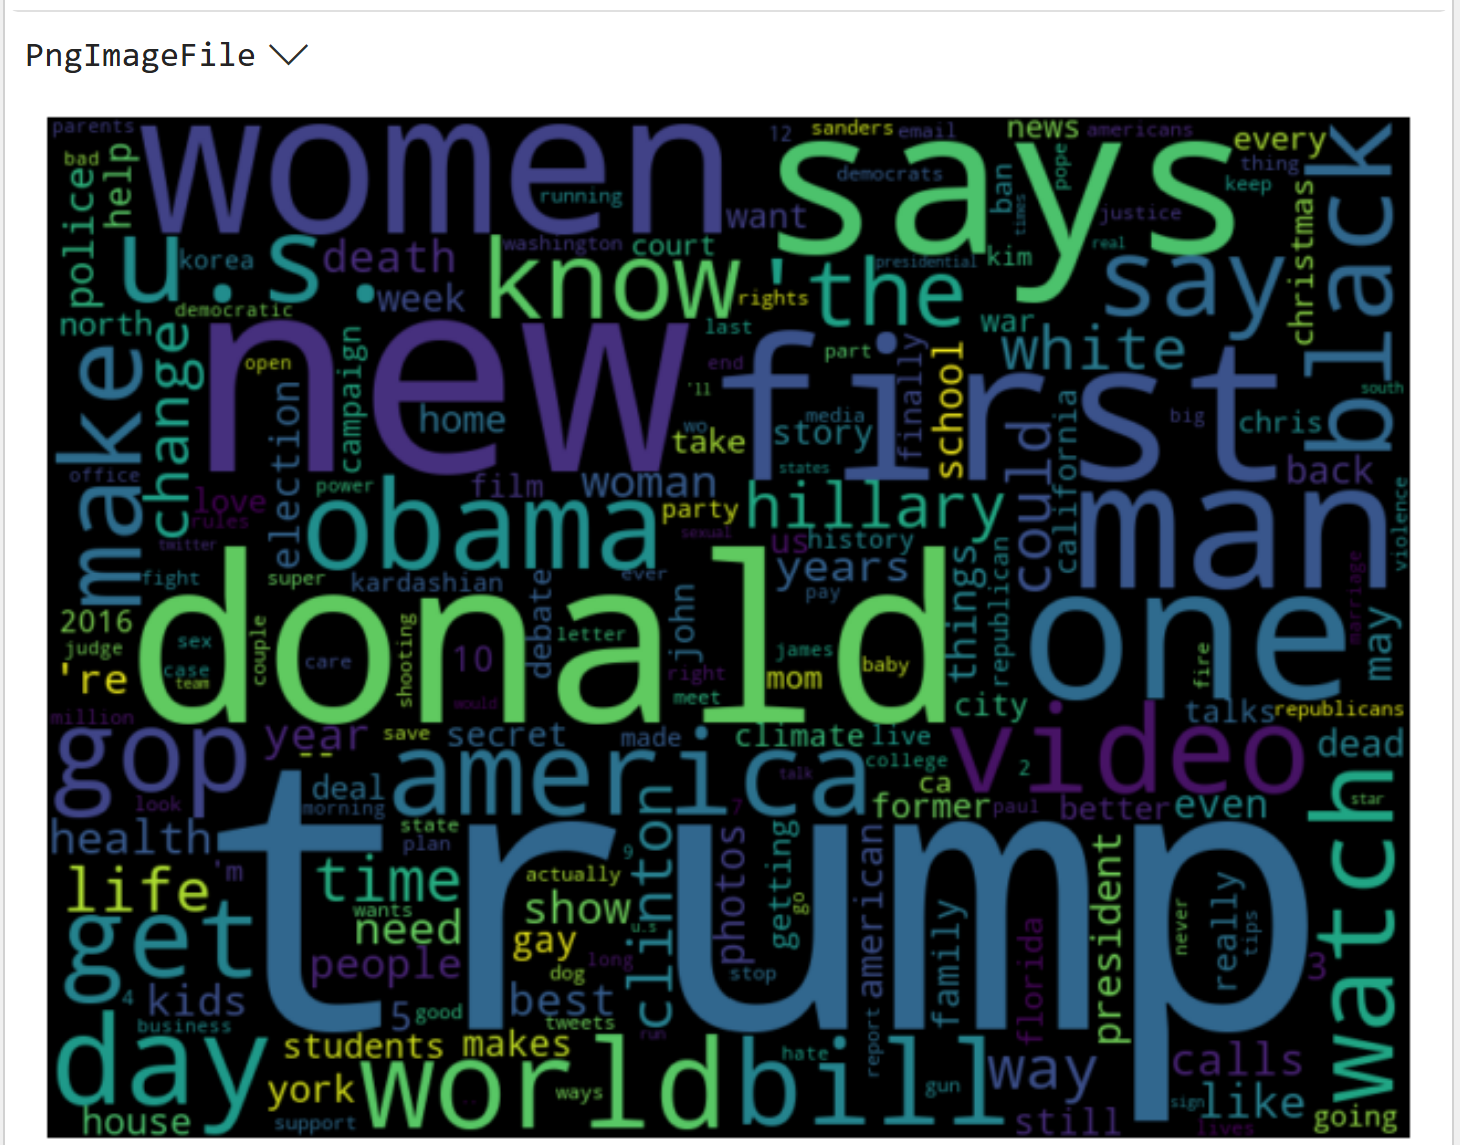
Comparing the above word clouds shows that token frequencies differ between the entire corpus and the subset of legitimate headlines.
Time to move on to the sarcastic headlines.
Sarcastic Headlines Word Cloud
The code for the sarcastic headlines word cloud, not surprisingly, is very similar:
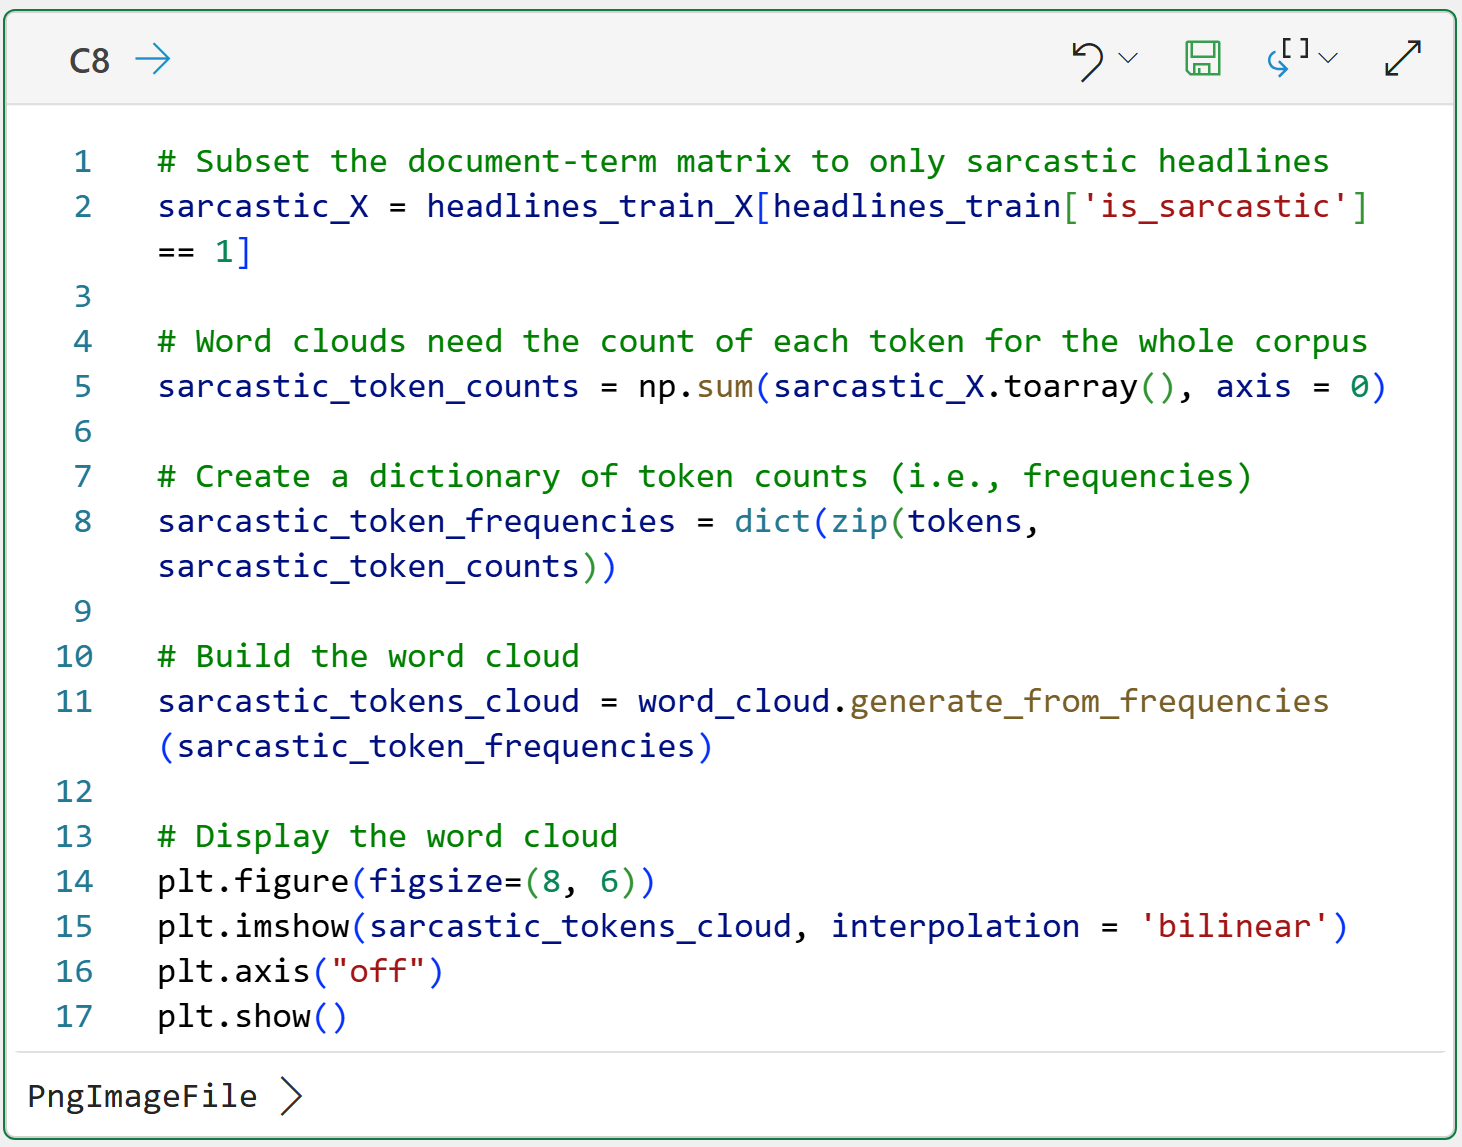
Once again, compare all three word clouds. Notice any differences?
This is an important idea in text mining that I will explore in more detail in my next newsletter.
This Week’s Book
To illustrate how wildly useful text mining can be, I dusted off a book I've had for years on my shelf from an unexpected author:

Yep! A book on text analysis written by an English professor for students studying literature. If text mining is useful for English Majors, and they can learn it, you can learn it and apply it as well.
That's it for this week.
My next newsletter will teach you how to use text mining to build something that is wildly useful in many real-world scenarios - a spam filter.
Stay healthy and happy data sleuthing!

Dave Langer
Whenever you're ready, here are 3 ways I can help you:
1 - The future of Microsoft Excel is unleashing the power of do-it-yourself (DIY) analytics using Python in Excel. Do you want to be part of the future? My Python in Excel Accelerator online course will teach you what you need to know, and the Virtual Dave AI tutor is included!
2 - Are you new to data analysis? My Visual Analysis with Python online course will teach you the fundamentals you need - fast. No complex math required, and the Virtual Dave AI Tutor is included!
3 - Cluster Analysis with Python: Most of the world's data is unlabeled and can't be used for predictive models. This is where my self-paced online course teaches you how to extract insights from your unlabeled data. The Virtual Dave AI Tutor is included!