
Join 1,000s of professionals who are building real-world skills for better forecasts with Microsoft Excel.
Issue #44 - Forecasting with Excel Part 7:
Using External Drivers
This Week’s Tutorial
Last week's tutorial sang the praises of Python in Excel by demonstrating how you can get better exponential triple smoothing (ETS) forecasts than can be achieved using Excel's native FORECAST.ETS() function.
This week's tutorial will take it up a notch by demonstrating how Python in Excel enables you to create state-of-the-art forecasts using external drivers.If you would like to follow along with today's tutorial (highly recommended), you will need to download the SalesTimeSeries.xlsx file from the newsletter's GitHub repository.
You will also need, of course, access to Python in Excel.
Endogenous vs Exogenous Features
When it comes to using data to build better forecasts, the features you use come in one of two forms. While there are technical definitions for the following, for this tutorial series I will take an intuitive approach:
Endogenous means the feature comes from "inside" the time series target values. For example, a moving average calculated from the time series target values is endogenous.
Exogenous means the features comes from "outside" the time series target values. For example, monthly marketing spend is an exogenous feature.
Classic time series models like those produced from Excel's FORECAST.ETS() function use only endogenous features.
However, modern business processes are very complex with many factors that impact the outcome. These complexities often mean that the best forecasting models will use endogenous and exogenous features.
In other words, if you want state-of-the-art forecasting then you need to incorporate external drivers in your forecasting models. This is where Python in Excel is a game-changer.
Preparing the Data
In an effort to keep this tutorial from being too long, I will assume you have some familiarity with Python in Excel. If you're new to Python in Excel, check out Part 6 of this tutorial series for detailed step-by-step instructions.
Using a dedicated worksheet to hold your Python in Excel formulas is a good idea. I typically name my worksheet simply Python Code:

Next, I organize my Python formulas vertically in the worksheet, forming a step-by-step execution order from top to bottom. I also add comments in the worksheet for each step:

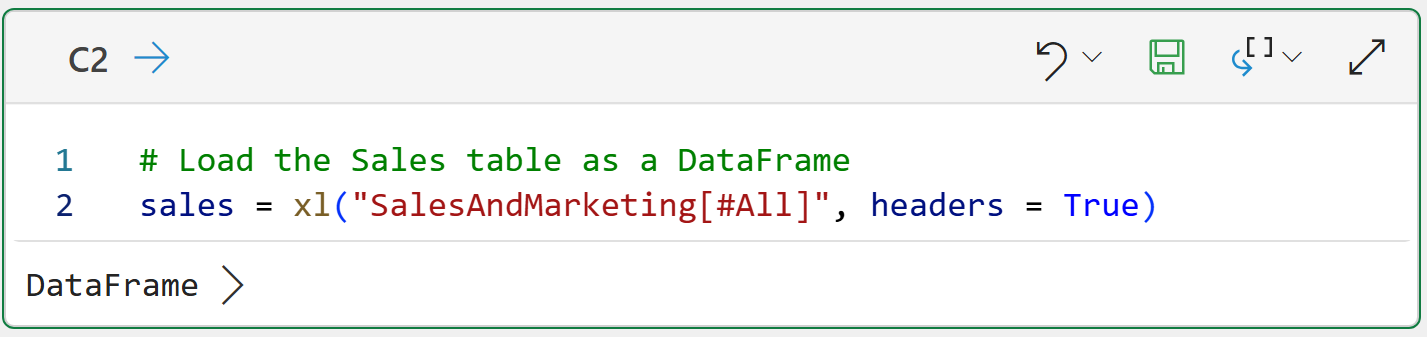
The actual Python formulas I place in column C aligned to the comments. For example, here's the formula for cell C3 to load the SalesAndMarketing table into Python:
The SalesAndMarketing table contains an exogenous feature for the monthly marketing spend:
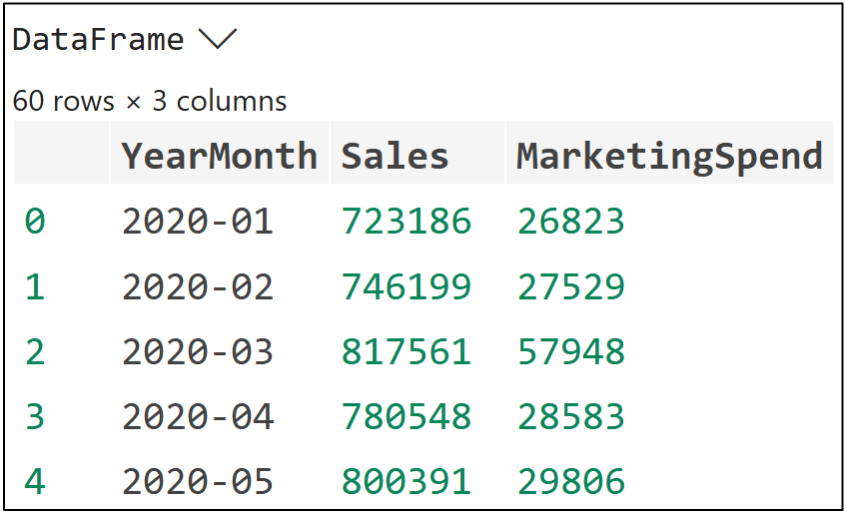
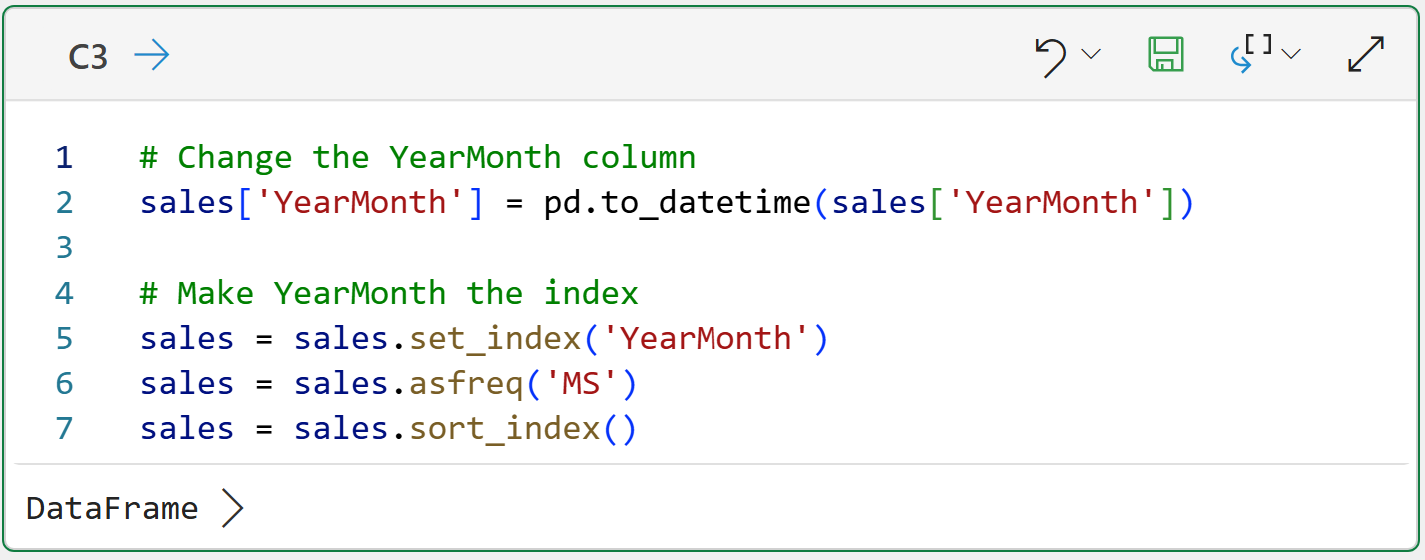
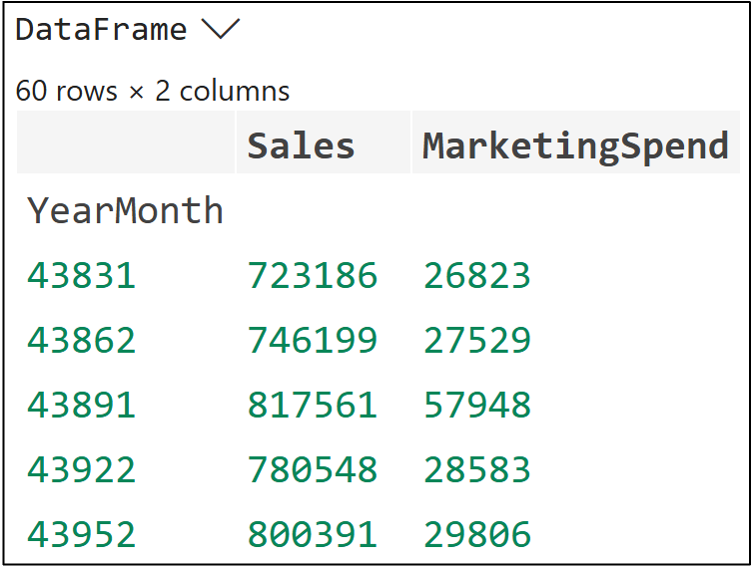
As covered in Part 6, Python in Excel includes the mighty statsmodels library which provides a number of powerful forecasting models. These models prefer DataFrames where the index is the timestamp:
In real-world projects, there is often a lot more data preparation that needs to happen than what you see here (e.g., getting access to the data in the first place).
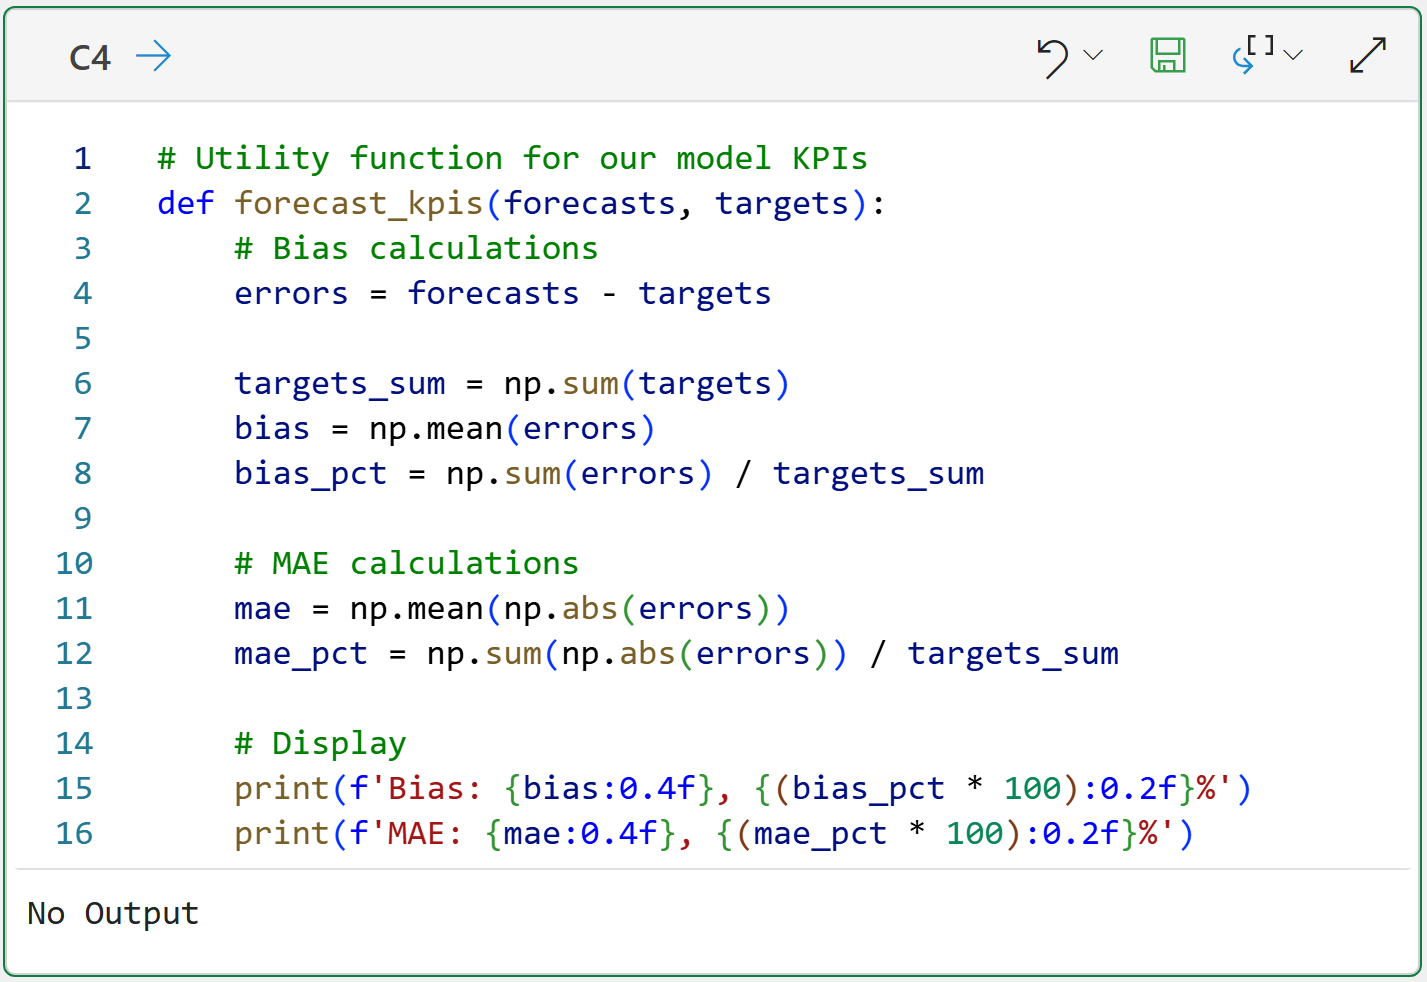
Forecast KPIs
As covered in Part 3, the bias and mean absolute error (MAE) calculations are used in this tutorial series to measure forecast accuracy.
The following Python formula creates a utility function to calculate and display these key performance indicators (KPIs):
Splitting the Data
As covered in Part 4 of this tutorial series, the best forecasters test their model predictions for accuracy by using a test holdout set with the following characteristics:
The latest of the time series data.
Enough data to cover at least one full cycle of any seasonality.
In the case of the time series used in this tutorial, the last full year of data is used as the test holdout set:

As detailed in the comments in the code above, the Sales column is the target (i.e., endogenous) data for this time series.
The dataset also contains the MarketingSpend feature which is exogenous data that must also be split using the same date-based logic:

With the data split, it's time to discuss details about using exogenous data in forecasting.
How to Use Exogenous Data
When used properly, exogenous data is a powerful way to increase the accuracy of your forecasts. Think of exogenous data as a way to add additional information that isn't available from the raw time series targets.
For example, consider the MarketingSpend feature of the tutorial's dataset. When done correctly, the budget spend on marketing activities should have a positive impact on Sales.
State-of-the-art forecasting models are able to leverage the information contained in exogenous features to create more accurate forecasts than are possible from only using endogenous data.
So, the best forecasters are always on the lookout for:
Exogenous features that can improve their forecasting models.
Forecasting techniques that can make maximum use of exogenous features (e.g., machine learning).
However, there's one big requirement for using exogenous data.
Any exogenous feature you use in your forecasting models must have future data available before you can make a forecast.
This is a bit abstract, so let me cement it with an example. Let's say you use the MarketingSpend exogenous feature to build a forecasting model using all the data available (i.e., through the end of 2024).
In order to make forecasts for 2025, you would need MarketingSpend values for each month of 2025 that you are trying to forecast. In this example, you could get the 2025 marketing budget numbers from the finance team to use in your forecasts.
Here are some additional examples of exogenous data that are often quite valuable and have future data available:
Capital investments
Product launches
Store openings
Weather
NOTE - Using weather in your forecasting models typically only works for relatively short forecasting horizons (e.g., up to a week).
Training a SARIMAX Model
Unfortunately, the options for building forecasting models that use exogenous features are limited using native Excel features (e.g., multiple linear regression using the Analysis ToolPak).
Luckily, the mighty statsmodels package provides the Seasonal AutoRegressive Integrated Moving Average with eXogenous regressors (SARIMAX) model that you can use with exogenous data.
Due to space considerations, I can't cover how SARIMAX works behind the scenes. However, the SARIMAX model is an extension of the popular ARIMA model and my next tutorial series will cover ARIMA using Python in Excel.
For the purposes of this tutorial, here's a SARIMAX model that works well with the Sales and MarketingSpend features:
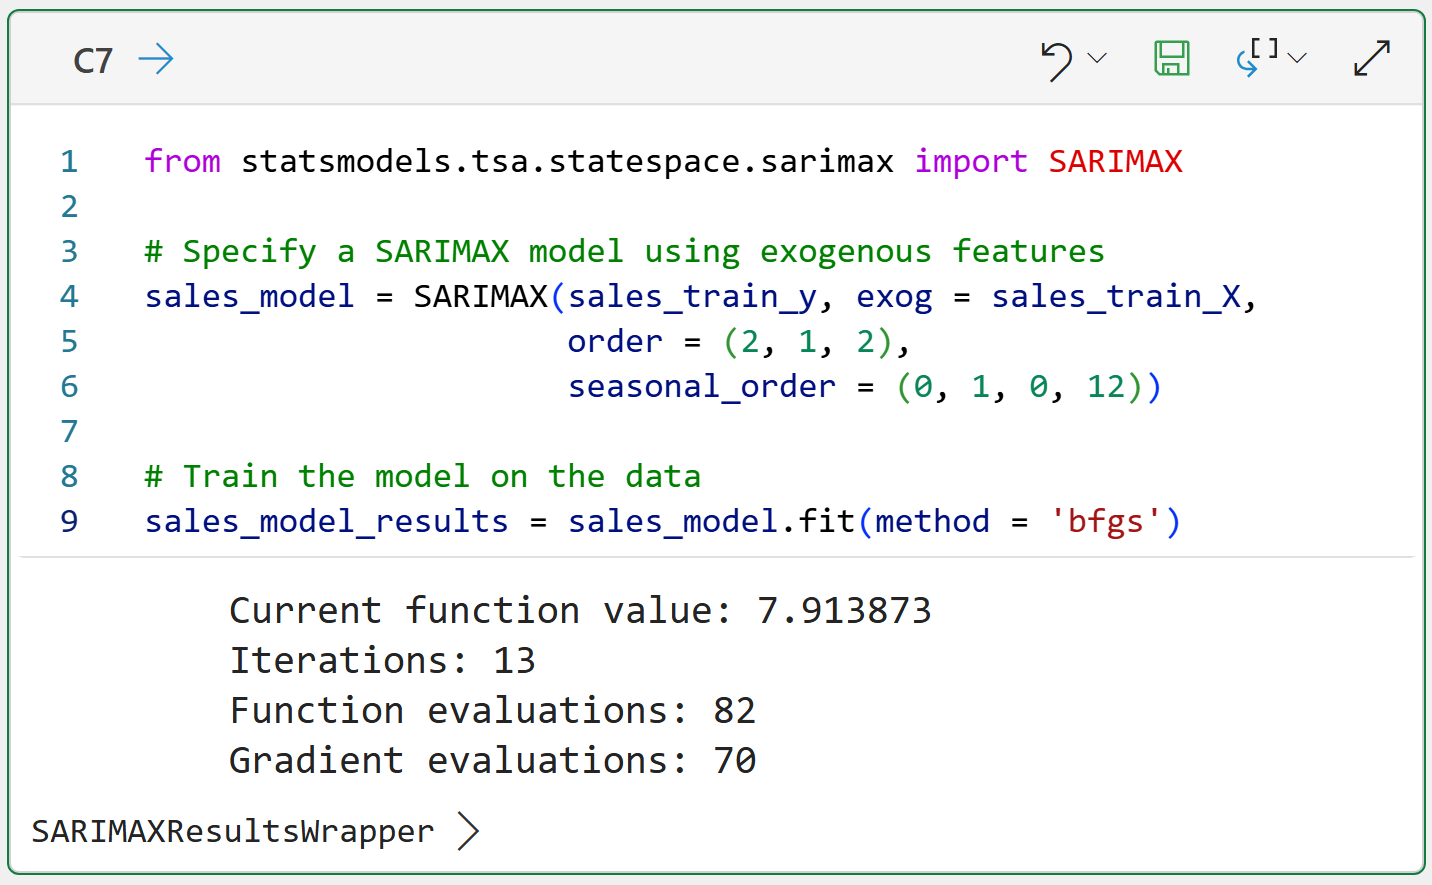
And the Python formula to evaluate the SARIMAX model's predictions against the test holdout:

The first thing to note about the code above is that to make any forecasts, you must pass in the future exogenous data using the exog parameter.
The second thing to note about the code above is that the SARIMAX model's MAE is an improvement over the ETS model from Part 6 of this tutorial series.
I know that this tutorial has been a whirlwind, but I wanted to illustrate that if you're serious about better forecasts, you can't go wrong building skills with Python in Excel and statsmodels.
This Week’s Book
I've recommended this free online book on forecasting in a previous newsletter, and it seemed appropriate to recommend it again due to its coverage of ARIMA:
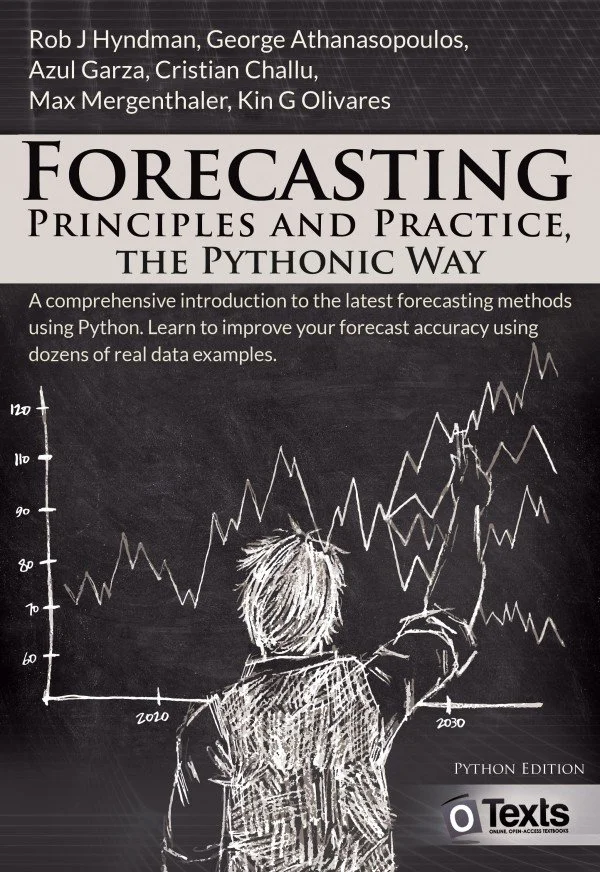
NOTE - The libraries used in this book are not available in Python in Excel at the time of this writing. However, it remains a valuable resource for learning more about forecasting.
That's it for this week.
Next week's newsletter will demonstrate, with the right skills, how you can use AI to accelerate your forecasting with Copilot in Excel.
Stay healthy and happy data sleuthing!

Dave Langer
Whenever you're ready, here are 3 ways I can help you:
1 - The future of Microsoft Excel forecasting is unleashing the power of machine learning using Python in Excel. Do you want to be part of the future? Order my book on Amazon.
2 - Are you new to data analysis? My Visual Analysis with Python online course will teach you the fundamentals you need - fast. No complex math required, and Copilot in Excel AI prompts are included!
3 - Cluster Analysis with Python: Most of the world's data is unlabeled and can't be used for predictive models. This is where my self-paced online course teaches you how to extract insights from your unlabeled data. Copilot in Excel AI prompts are included!