
Join 1,000s of professionals who are building real-world skills for better forecasts with Microsoft Excel.
Issue #41 - Forecasting with Excel Part 4:
Is Your Model Any Good?
This Week’s Tutorial
Forecasting is about predicting the future. But you don't have a time machine. So, how can you trust that your forecasts are accurate?
In this week's tutorial, you will learn how to test your models by simulating the future.
Unfortunately, most professionals (e.g., Finance pros) are not taught how to do this. This is your opportunity to stand out.
If you would like to follow along with today's tutorial (highly recommended), you will need to download the SalesTimeSeries.xlsx file from the newsletter's GitHub repository.
Simulating the Future
To build better forecasts, you must use your data to simulate the future. You do this by splitting your data into two sets:
The oldest data becomes what you use to build your forecasts.
The newest data becomes what you use to test forecast accuracy.
Here's why this strategy is critical to your forecasting success.
First, by using only the oldest data to build your forecasts, you are hoping to discover the underlying patterns that stand the test of time.
Imagine that you're forecasting sales and have 6 years of monthly data. You use the first 4 years to build and the last 2 years to test.
If your forecasts are accurate, you've found these patterns. But that's not all.
Second, consider a forecasting model that received the first 4 years of sales data.
From the model's perspective, the future starts with the first month of the test data (i.e., January of year five). This is how you simulate the future.
Is this simulation perfect?
Absolutely not. But it's the best you can do.
And, as I mentioned above, most professionals haven't been taught how to do it.
Splitting the Data
The Sales table of the tutorial Excel workbook has 5 years of monthly sales data.
While there is no magical equation that tells you how much data should be split between building your forecasting model (i.e., the training dataset) vs. the test dataset, here are some guidelines:
Each dataset set should include, at a minimum, one complete cycle of seasonality.
More data is better than less data.
As covered in Part 2, the Sales data exhibits yearly seasonality. Therefore, here are two reasonable approaches to splitting the data:
Use 3 years of data for training and 2 years for testing.
Use 4 years of data for training and 1 year for testing.
I will cover option 2 in this tutorial series. Try out option 1 and compare the results.
A Simple Moving Average Model
In Part 3 of this tutorial series, I introduced the use of a simple 6-month moving average as a forecasting model. I will continue to use this MA(6) model as a baseline in this tutorial.
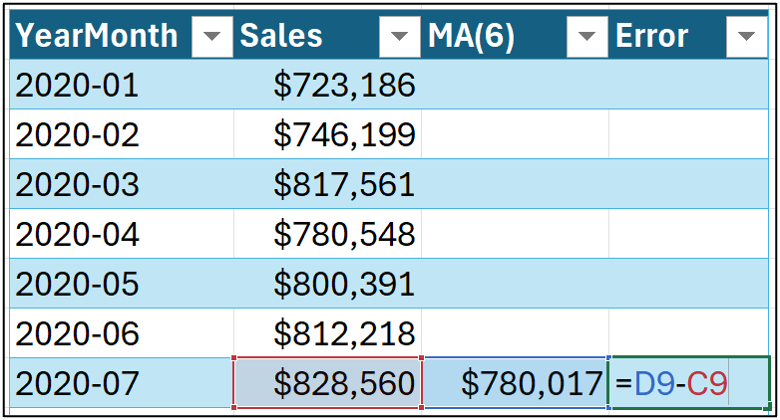
Setting up the MA(6) model in Microsoft Excel is straightforward:
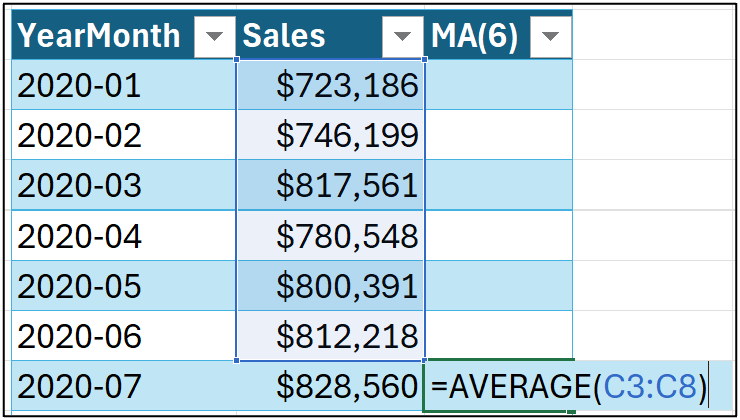
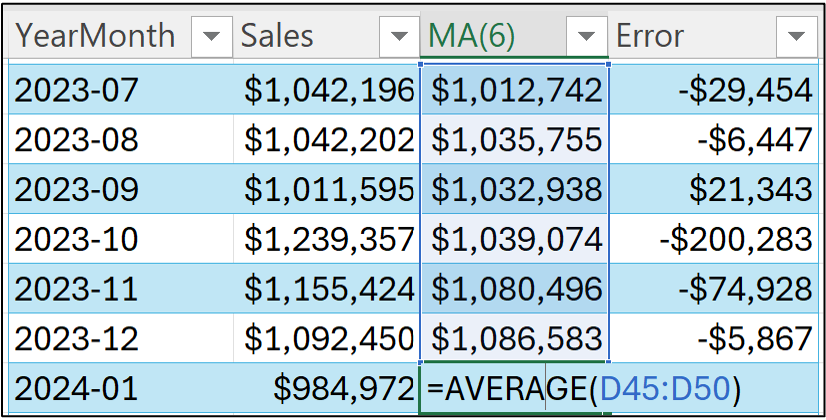
Given my choice of reserving the last year of data for testing (often referred to as the test holdout), I drag the MA(6) formula down the length of the table and stop at the end of 2023:

As covered in Part 3, you can certainly measure the accuracy of the MA(6) model's forecasts against the historical data.
However, we typically care most about the forecast accuracy with respect to the test dataset.
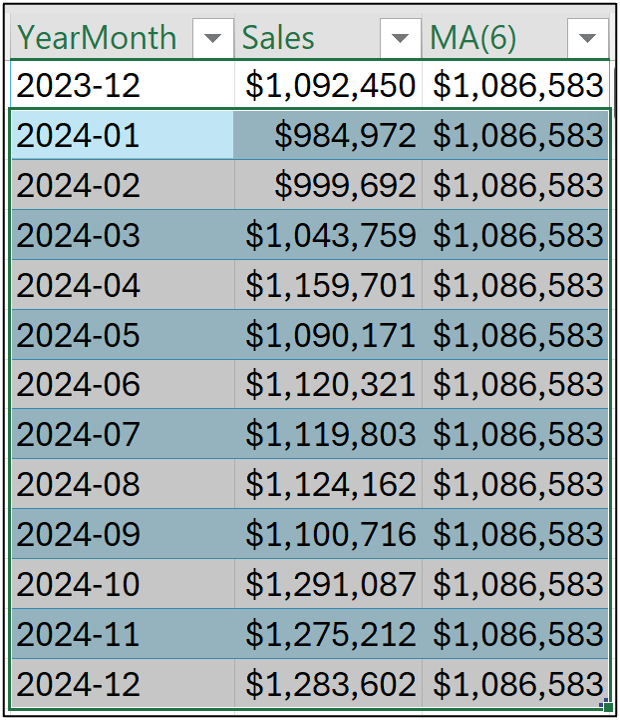
The simplest form of an MA(6) forecasting model will predict the last value for the test dataset. In this case, the value from cell D50:

To put the test dataset forecasts in context, a quick line chart is a very handy tool.
First, select the data for 2024:
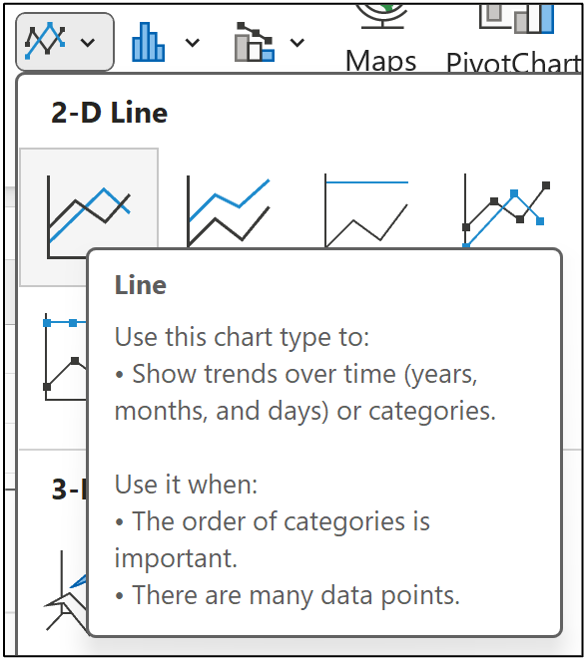
And then insert a line chart using the Ribbon:
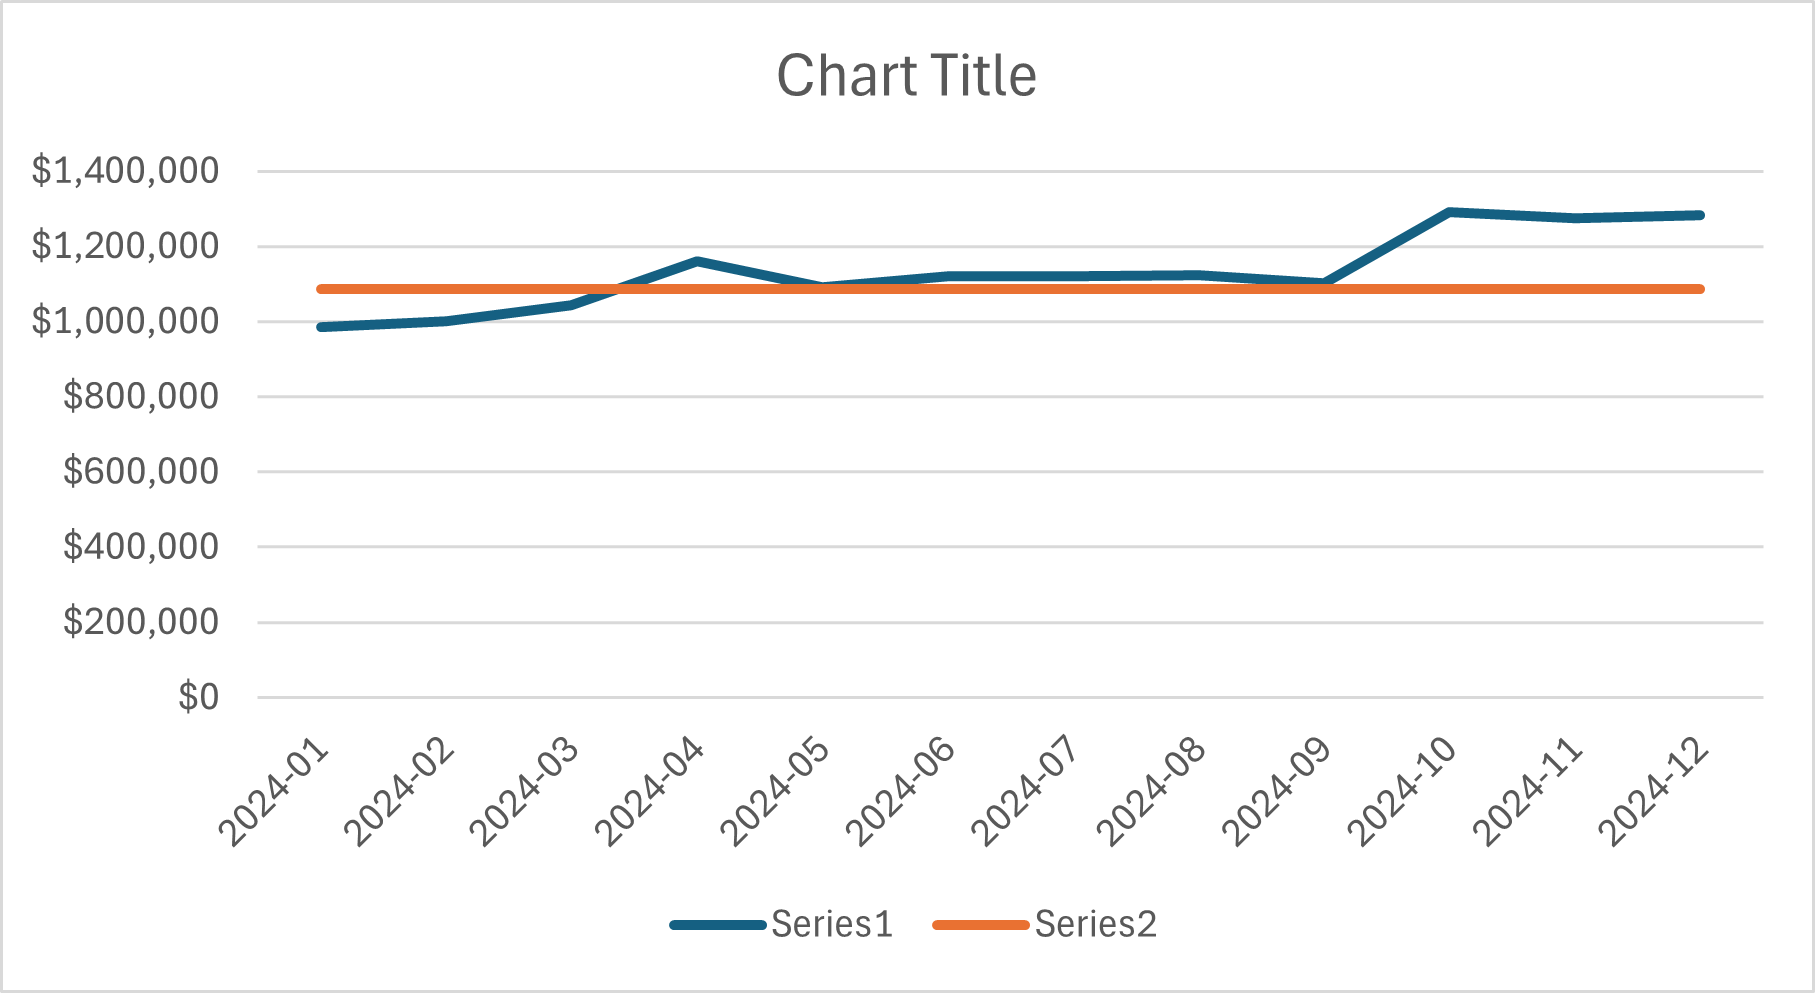
The straight orange line in the visualization above are the MA(6) forecasts.
There are a few things worth noting in the line chart:
The MA(6) forecasts are too high for Jan, Mar, and Apr.
The MA(6) forecasts are very close for May through Sep.
The MA(6) forecasts are too low for Oct, Nov, and Dec.
Overall, this doesn't look too bad based on the visual. However, you don't want to rely solely on eyeballing the data.
That's where the KPIs come into the picture.
Simple MA(6) KPIs
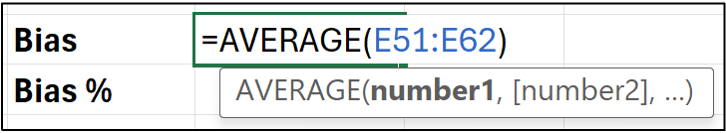
I cover the bias and mean absolute error (MAE) KPIs in Part 3 of the tutorial series, so check out the tutorial if you're not familiar with these calculations.
First, calculating the MA(6) forecasting errors in column E:
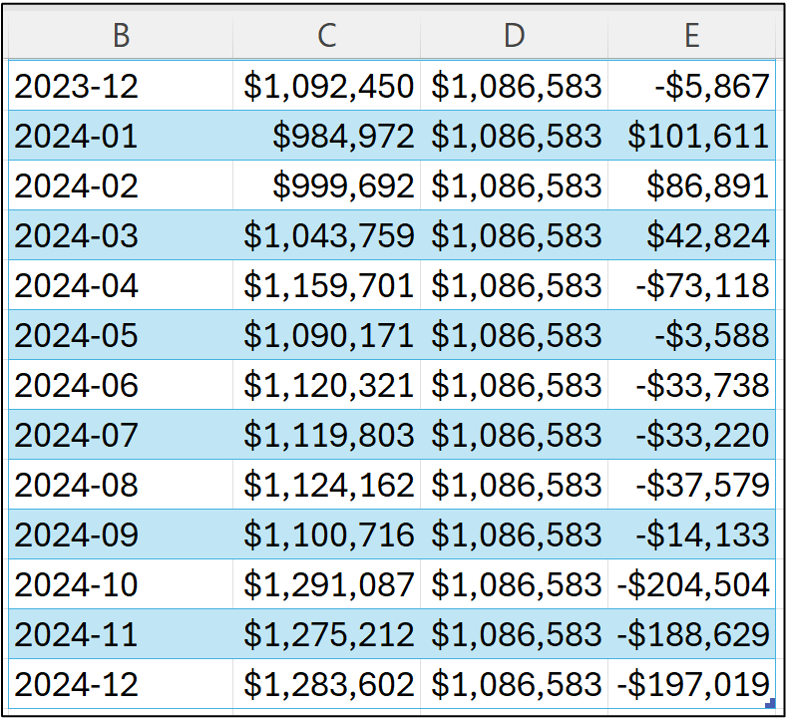
And the KPIs for just the test dataset (i.e., only for 2024):


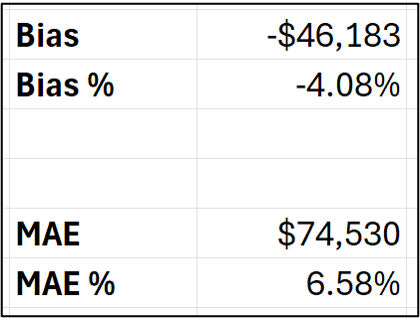
Assuming that the test dataset is a reasonable simulation of the future, here's what the KPIs tell us about the MA(6) model:
The forecasts will be, on average, 4.25% too low.
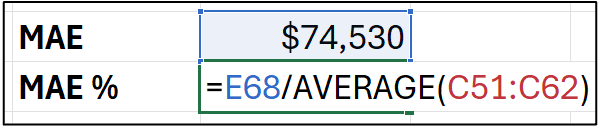
The forecasts will be, on average, off by $74,530.
The forecasts will be, on average, off by 6.86%.
A Revised MA(6) Model
What you've seen so far isn't the only way moving averages can be used as forecasting models.
For example, the moving average calculation doesn't have to stop with the end of the training dataset. You can use the model predictions in later calculations.
Conceptually, the model uses its previous predictions to create new predictions.
This is a bit abstract, so here's the formula to demonstrate:
Notice in the formula above that the moving average is now calculated from the MA(6) model predictions. Dragging the formula down the length of the table changes the forecasts, errors, and KPIs:

The KPIs tell us that the revised MA(6) model performs worse than the simple MA(6) model.
However, don't let this deter you from the powerful idea of forecasting models using previous predictions to make future ones.
This technique is used in a large number of forecasting techniques (e.g., Excel's FORECAST.ETS() function) and is quite powerful - even if it didn't work out so well in this particular case.
This Week’s Book
I hope you will forgive me for sharing this. I received some great news from my editor this week. My upcoming book has been purchased by Barnes & Noble for hundreds of their stores!

As a first-time author, I'm beyond excited about the possibility of helping many professionals unleash the power of their data using Python in Excel. You can pre-order the book at Barnes & Noble.
That's it for this week.
Next week's newsletter will build upon everything you've learned so far to use Microsoft Excel's premier forecasting technique - the FORECAST.ETS() function.
Stay healthy and happy data sleuthing!

Dave Langer
Whenever you're ready, here are 3 ways I can help you:
1 - The future of Microsoft Excel forecasting is unleashing the power of machine learning using Python in Excel. Do you want to be part of the future? Order my book at Barnes & Noble.
2 - Are you new to data analysis? My Visual Analysis with Python online course will teach you the fundamentals you need - fast. No complex math required, and Copilot in Excel AI prompts are included!
3 - Cluster Analysis with Python: Most of the world's data is unlabeled and can't be used for predictive models. This is where my self-paced online course teaches you how to extract insights from your unlabeled data. Copilot in Excel AI prompts are included!