
Join 1,000s of professionals who are building real-world skills for better forecasts with Microsoft Excel.
Issue #42 - Forecasting with Excel Part 5:
Using FORECAST.ETS()
This Week’s Tutorial
Through this tutorial series you've be learning the fundamentals of time series forecasting using Microsoft Excel.
In this week's tutorial, you will learn the premier way to build data-driven forecasts using native Excel features - the FORECAST.ETS() function.
If you would like to follow along with today's tutorial (highly recommended), you will need to download the SalesTimeSeries.xlsx file from the newsletter's GitHub repository.
Preparing the Data
The FORECAST.ETS() function requires the use of Excel-formatted dates. The Sales table in the tutorial workbook represents a common situation where Excel doesn't like the format:

As covered in Part 2 of this tutorial series, the answer to this problem is to insert a Date column using the following formula to convert the YearMonth data into an Excel-friendly format:

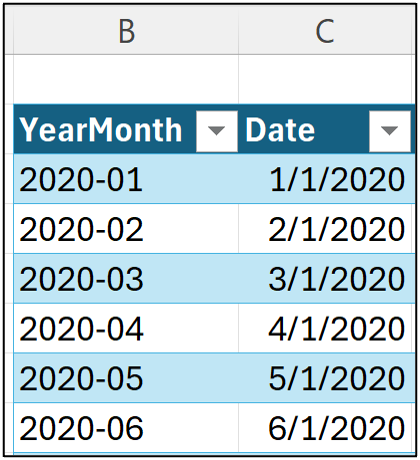
NOTE - You may need to explicitly format column C as Excel dates if your table doesn't look like the above image.
Establishing the Baseline
As covered in Part 4 of the tutorial series, I'm going to use the following to establish a baseline:
All data through December 2023 for training the forecasting model.
All data for 2024 for testing the forecast model.
A simple 6-month moving average baseline model.
The first step is to calculate the 6-month moving average for December 2023 by adding a MA(6) Forecast column and entering the following in cell E50:

Next, the forecasts for 2024 are simply the forecasted value for December 2023:

As covered in Part 3, next up is calculating the MA(6) errors in a new column:
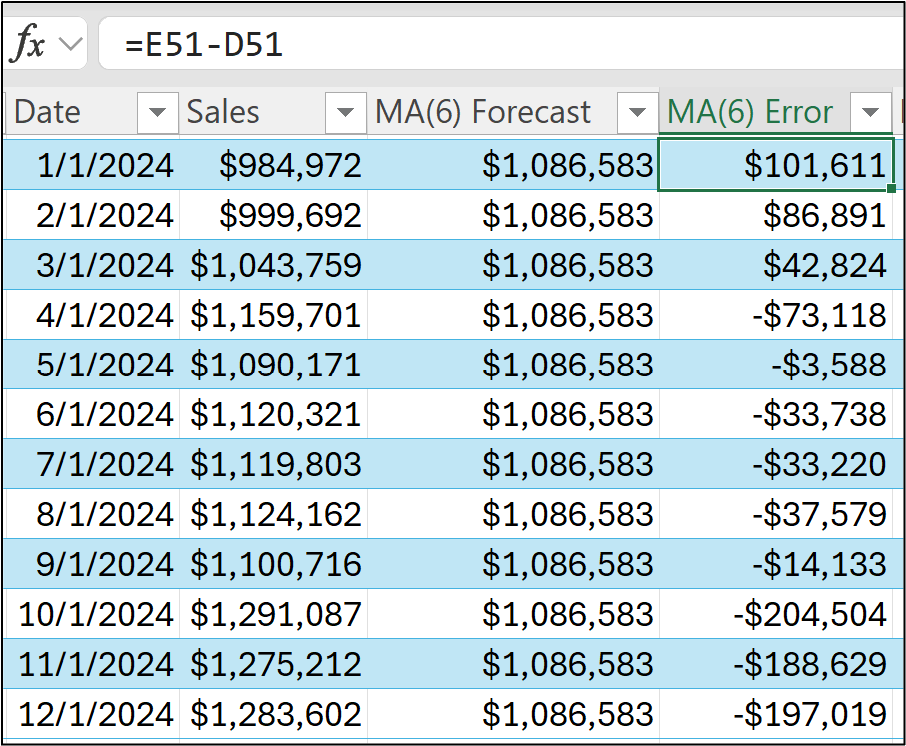

Here's what the KPIs tell us:
The MA(6) baseline typically forecasts values too low for the test dataset.
On average, the MA(6) baseline is 4.08% too low.
The typical MA(6) baseline is off by $74,530.
On average, the MA(6) baseline is off by 6.58%.
With the baseline established, it's now time to see if the FORECAST.ETS() function can provide uplift (i.e., beat the baseline KPIs).
FORECAST.ETS() Intuition
The FORECAST.ETS() function was added to Microsoft Excel 2016 and empowers millions of professionals to build better data-driven forecasts.
The ETS portion of the function name stands for exponential triple smoothing, a battle-tested forecasting model in use for more than 60 years. For this tutorial series, an intuitive understanding of ETS is enough.
You can think of ETS as learning the following from time series data:
The average target of the time series, which is known as the level.
The average amount of fluctuation between two consecutive targets in the time series known as the trend.
Patterns that appear at regular intervals (e.g., weekly or monthly) that impact the level known as the seasonality.
Using ETS, each forecast can be thought of as being:
Forecast = Level + Trend + Seasonality
Now for the intuition around exponential smoothing.
Consider 1 above. Conceptually, this is similar to a moving average forecasting model. However, a moving average model treats each data point equally in the calculation.
ETS brought the innovation of placing more importance to recent data points versus older data points. In some cases, ETS will severely penalize older data points to arrive at a better forecasting model (i.e., exponential smoothing).
If this seems overwhelming, then you'll probably find this refreshing.
The FORECAST.ETS() function does all this for you automagically.
Using FORECAST.ETS()
With the intuition established, it's time to apply ETS to the Sales time series dataset.
The FORECAST.ETS() function has some requirements that you need to be aware of. From Microsoft's website:
"This function requires the timeline to be organized with a constant step between the different points. For example, that could be a monthly timeline with values on the 1st of every month, a yearly timeline, or a timeline of numerical indices."
This is just a fancy of way of saying your dataset must be at a constant grain (e.g., monthly sales) and can't have any holes in the dates (e.g., January 2022 is missing).
The easiest way to get started with FORECAST.ETS() is to use only its three required arguments:
The date for which the forecast is created.
The historical targets.
The historical dates.
First, a FORECAST.ETS() column will hold the forecasts. For the tutorial dataset, the first forecast for the test dataset is January 2024 (i.e., cell C51). Here's the first step of setting up the formula:

Next is adding the historical time series values (i.e., all the Sales values through December 2023):
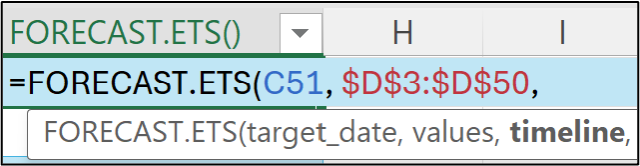
Last, adding the historical dates:

Hitting <enter> gives the first forecast for the test dataset. The rest of the 2024 forecasts are simply a matter of dragging the formula down:

As you can see in the image above, ETS is far more varied in its forecasts compared to using a simple MA(6) model.
However, are the ETS forecasts better?
FORECAST.ETS() KPIs
As you've learned, calculating forecast errors is the first step in evaluating your forecasts:

And The image above shows adding a new FORECAST.ETS() Error column to the table with the error formula in cell F51. Hitting <enter> and dragging the formula down: RMSE:
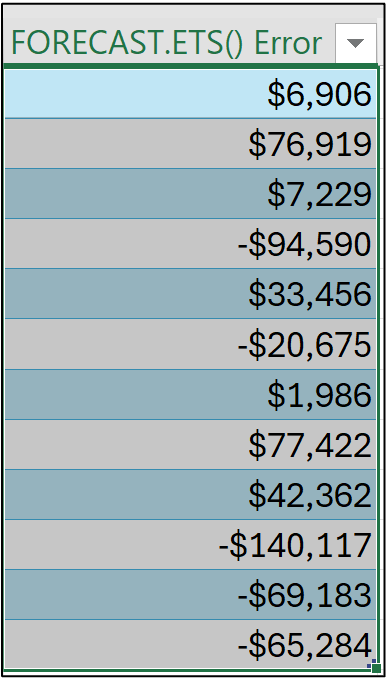

And the KPIs for the ETS forecasts:
Yesssss!
Moving to a more complex model has improved the forecast KPIs.
This Week’s Book
Moving to data-driven forecasts can be a big cultural change for many organizations. Often, simply saying, "these forecasts are better," is not enough. This is where the power of data storytelling comes into play:

Brent's book is my absolute favorite for teaching you the power of data storytelling because it focuses on the real challenge of driving change with data - the humans in your organization.
That's it for this week.
Next week's newsletter will show you the biggest thing ever to happen to forecasting with Microsoft Excel - Python formulas.
Stay healthy and happy data sleuthing!

Dave Langer
Whenever you're ready, here are 3 ways I can help you:
1 - The future of Microsoft Excel forecasting is unleashing the power of machine learning using Python in Excel. Do you want to be part of the future? Order my book on Amazon.
2 - Are you new to data analysis? My Visual Analysis with Python online course will teach you the fundamentals you need - fast. No complex math required, and Copilot in Excel AI prompts are included!
3 - Cluster Analysis with Python: Most of the world's data is unlabeled and can't be used for predictive models. This is where my self-paced online course teaches you how to extract insights from your unlabeled data. Copilot in Excel AI prompts are included!