

Join 1,000s of professionals who are building real-world skills for better forecasts with Microsoft Excel.
Issue #68 - Data Cleaning Fundamentals Part 2:
Fixing Data Types
This Week’s Tutorial
In Part 1, you profiled a dirty customer orders dataset. But you haven't actually cleaned the data yet. Instead, you asked questions like:
How many rows and columns are in the dataset?
Which columns have missing values?
Are there duplicate rows?
Are there repeated order IDs?
Do numeric-looking columns actually behave like numbers?
Do date-looking columns actually behave like dates?
Do categorical columns contain inconsistent labels?
This first step is critical because data cleaning should not start with random fixing. You should start by diagnosing what's what in your dataset.
In this tutorial, you will start fixing one of the most common problems in dirty data:
Columns that look like one data type but are actually stored as another.
This is incredibly common in real business data. A column may look like a number because it contains values such as $125.00 or 10%. Or a column may appear to be a date because it contains values such as 1/15/2025.
But that does not mean Python sees those values as numbers or dates.
In this tutorial, you will fix the most important data type issues in the tutorial's customer orders dataset.
What You’ll Learn
In this tutorial, you will learn how to:
Copy a raw dataset before cleaning it
Clean column names enough to make code easier
Identify columns that are stored using the wrong data type
Convert text-like numbers into real numeric columns
Convert text-like dates into real date columns
Convert inconsistent yes/no values into a cleaner field
Create a simple before-and-after data type report
NOTE - While this tutorial will rely on the pandas library using Python in Excel, the code is 99+% the same whether you use Excel, Jupyter Notebook, or VS Code.
The Dataset
This tutorial will continue using the synthetic customer orders dataset stored in the DataCleaningFundamentals.xlsx workbook available from the newsletter's GitHub repository.
I highly recommend that you download the data and write all the code in this tutorial. The code becomes a library that you can reuse in your own project via copy-paste-tweak.
The first step is to load the raw data into a DataFrame. This is how the pandas library represents an entire table of data in Python:
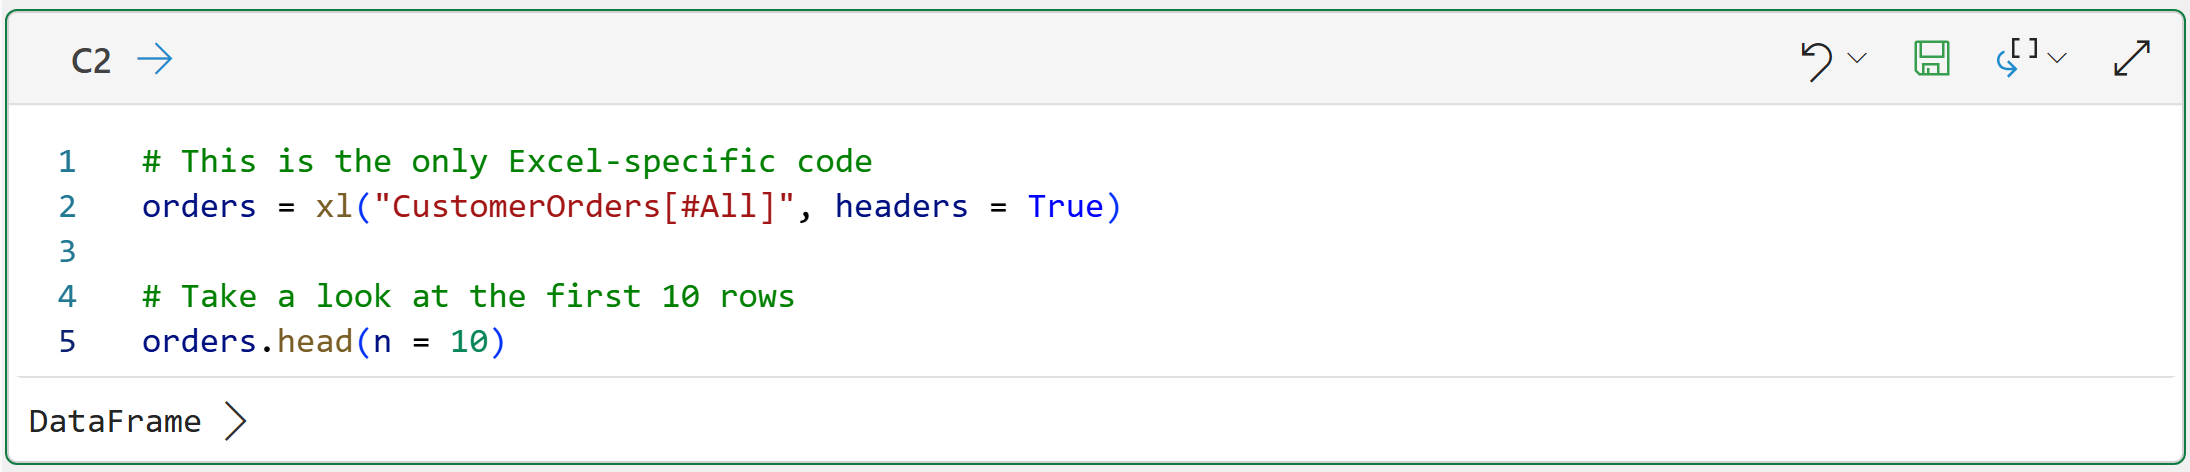
You name the variable orders_raw on purpose in the Python code. The name reminds you that this is the original version of the data.
You do this because you don't want to accidentally overwrite the original DataFrame before you understand your cleaning steps.
Why Data Types Matter
Data types determine what Python can do with a column. For example, if a column is stored as text, then it makes no sense to try to calculate a sum or average for the column.
If a date column is stored as text, Python may not be able to calculate time differences. If a yes/no column has many inconsistent values, Python may not be able to filter it reliably.
Here’s the big idea:
A value can look correct to a person and still be stored incorrectly for analysis.
For example, these values look like numbers to the human eye:
$120.00
1,250.50
USD 89.99
10%
But they include characters that prevent Python from treating them as numeric values.
Data type cleaning helps turn messy imported values into analysis-ready columns.
Step 1: Check Current Column Types
You start by checking the current data types:
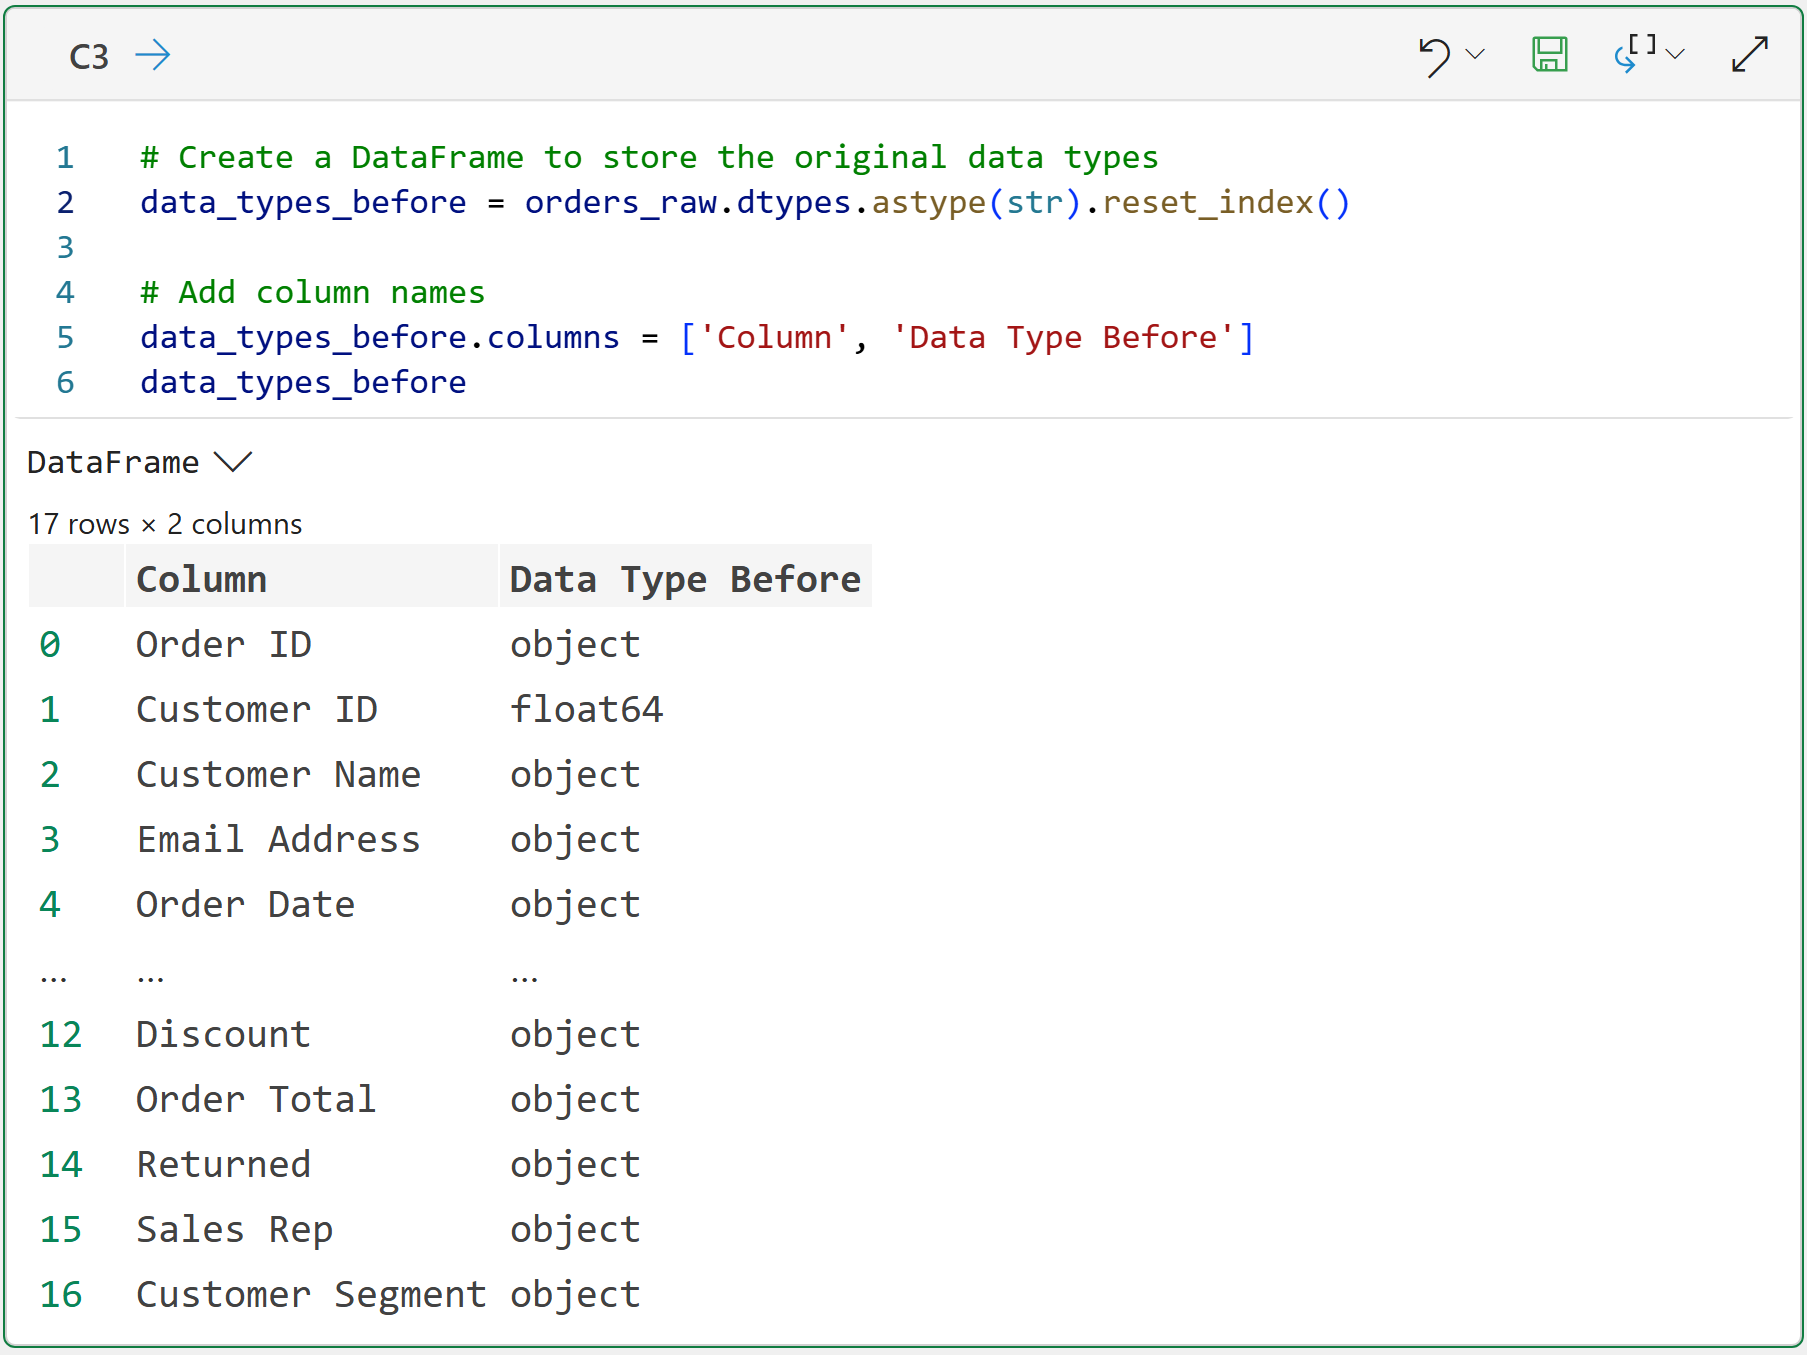
Many columns will likely appear as a pandas object data type. The pandas library uses the object data type to denote text-like data (i.e., strings in Python terms).
That's not always bad.
Columns like Customer Name and Email Address should be text. But columns like Order Date, Discount, and Order Total need more attention - as you can see in cell C3's output above.
Step 2: Make a Working Copy
Before cleaning, always create a copy of your original DataFrame:

The code above gives you a working copy of the original DataFrame named orders. The original version of the data remains available as orders_raw.
This is an important habit to build.
When cleaning data, you generally want to preserve the original data and create a cleaned version separately.
Step 3: Clean Column Names Just Enough
Before fixing data types, you should clean the column names. This isn't the main focus of the tutorial, but it makes the rest of the code easier and future-proofs your cleaned DataFrame for many analysis techniques you might want to use.
In Part 1, you saw that the column names had leading/trailing spaces and embedded spaces as well. Here's how you can fix these issues:
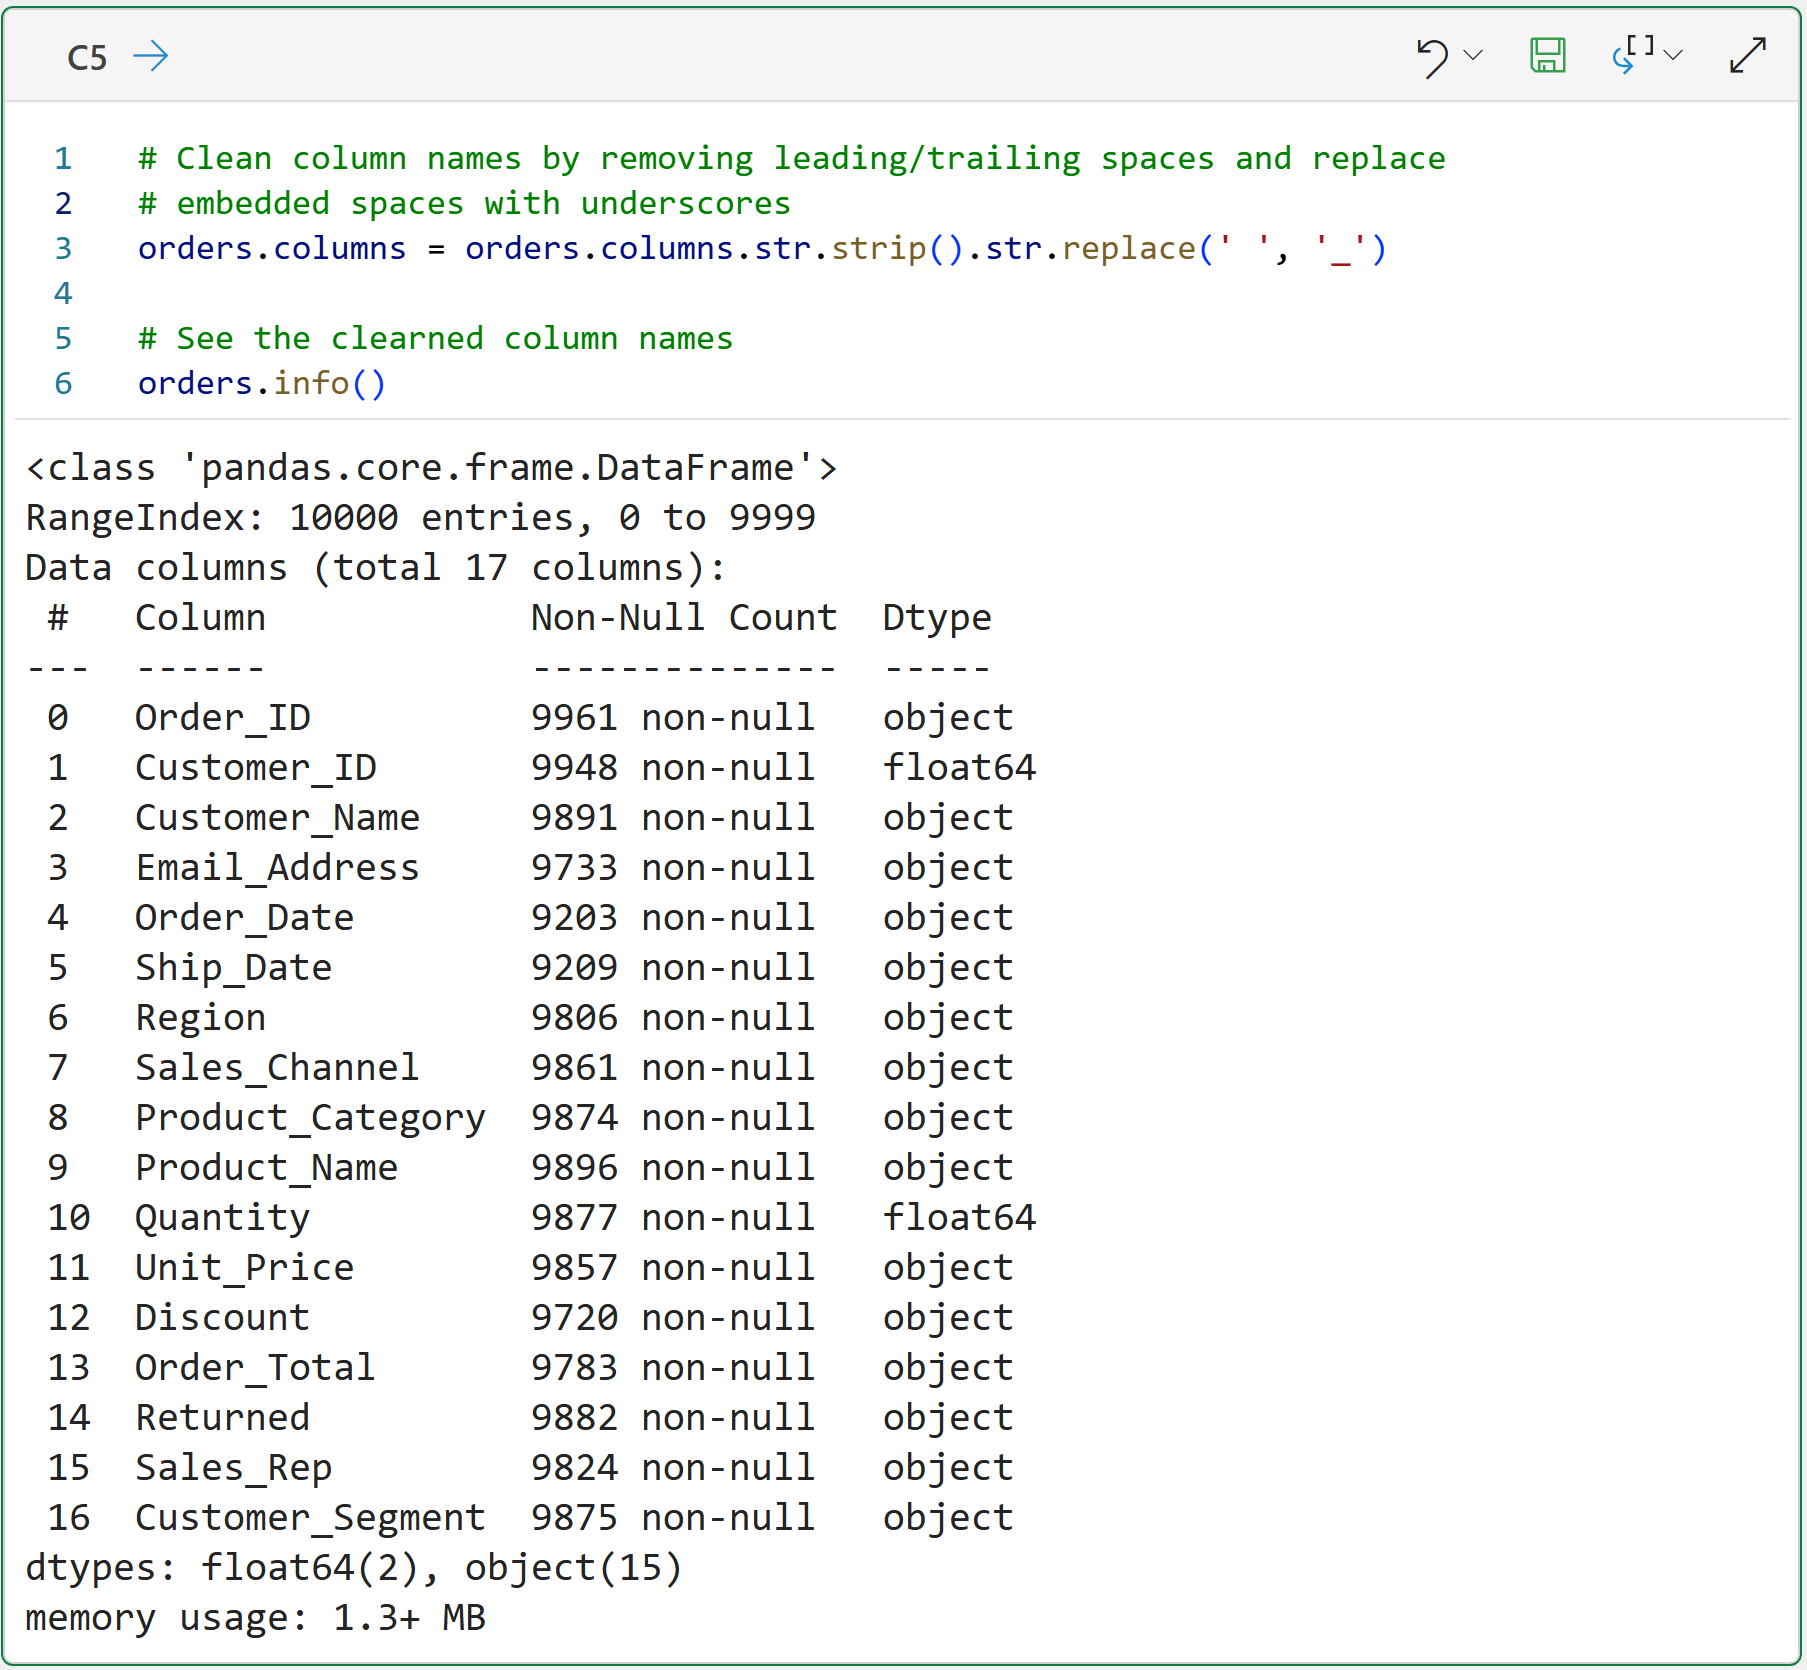
The above code does two simple things:
Removes leading and trailing spaces from column names (i.e., the str.strip() method).
Replaces spaces with underscores (i.e., the str.replace() method).
This is not required, but it often makes pandas code easier to read and prevents errors with certain analytics techniques.
Step 4: Identify Columns by Intended Type
Now you must decide what data type is appropriate for each column you will use in your data analysis. This is important because you don't want to waste time cleaning columns you won't be using.
To arrive at this list of important columns, don't just ask:
What data type is this column right now?
Also ask:
What data type should this column be for my analysis?
For this dataset, you can think about the columns this way:
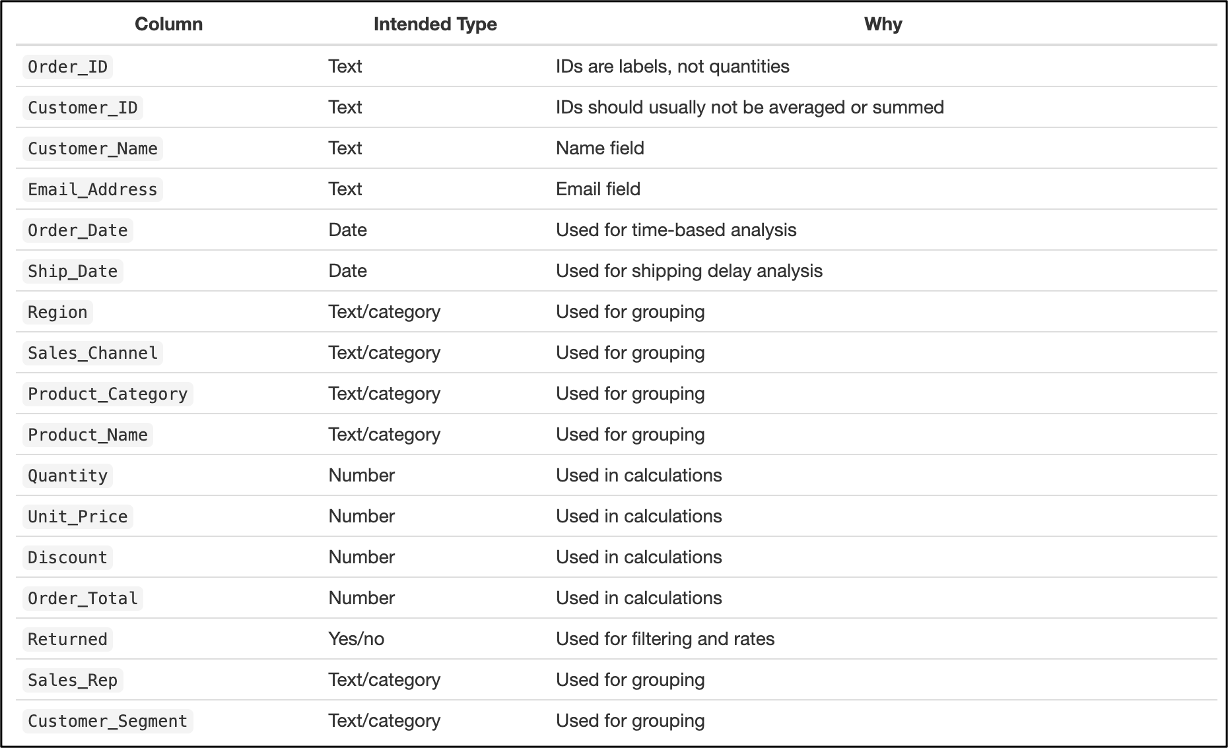
One important point:
You should treat IDs as text, even when they are only numbers.
For example, a Customer ID of 10025 is not a quantity. It's a label that uniquely identifies a customer. For example, it makes no sense to calculate the average of all Customer IDs even if they're numbers.
So, you shouldn't force every number-looking column into a numeric type out of force of habit. Consider the business meaning of each column first.
Step 5: Convert ID Columns to Strings
Here's code to explicitly change the Customer_ID column to be text (Order_ID is already considered to be text by pandas as shown in Step 3):
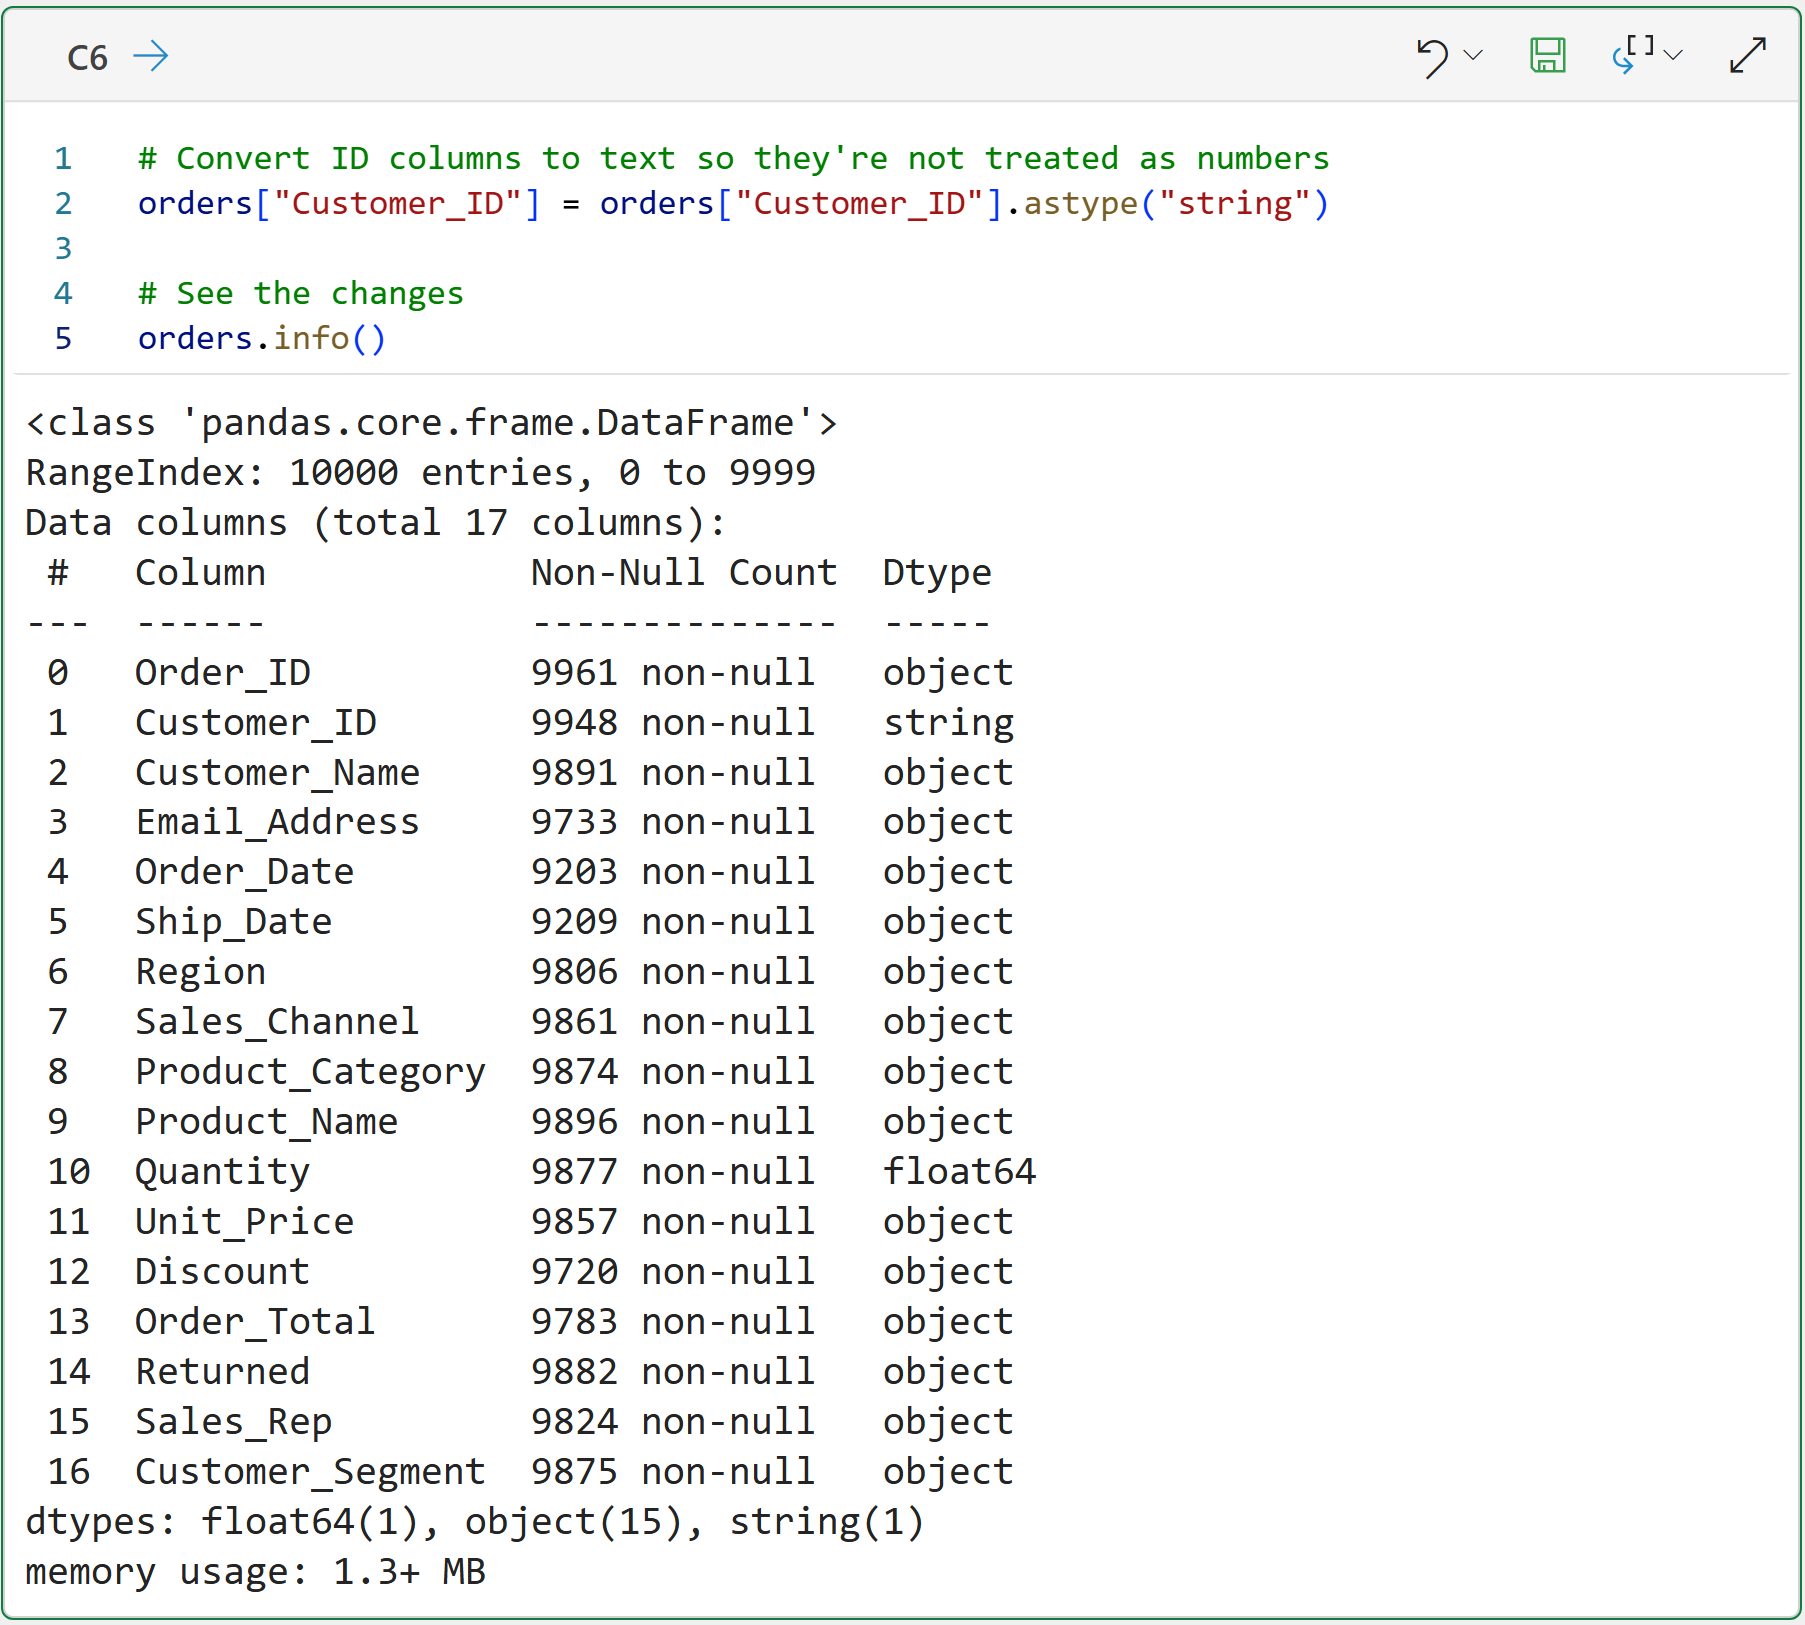
This helps prevent IDs from being treated like numbers. It also helps preserve leading zeros in datasets where IDs contain them.
This dataset doesn't rely on leading zeros, but the habit is useful.
Step 6: Convert Quantity to a Number
The Quantity column is already treated as numeric by pandas, but I wanted to show you how to clean a "simple" numeric column. Later steps in this tutorial will deal with more complex numeric columns (e.g., Discount).
Here's the code:
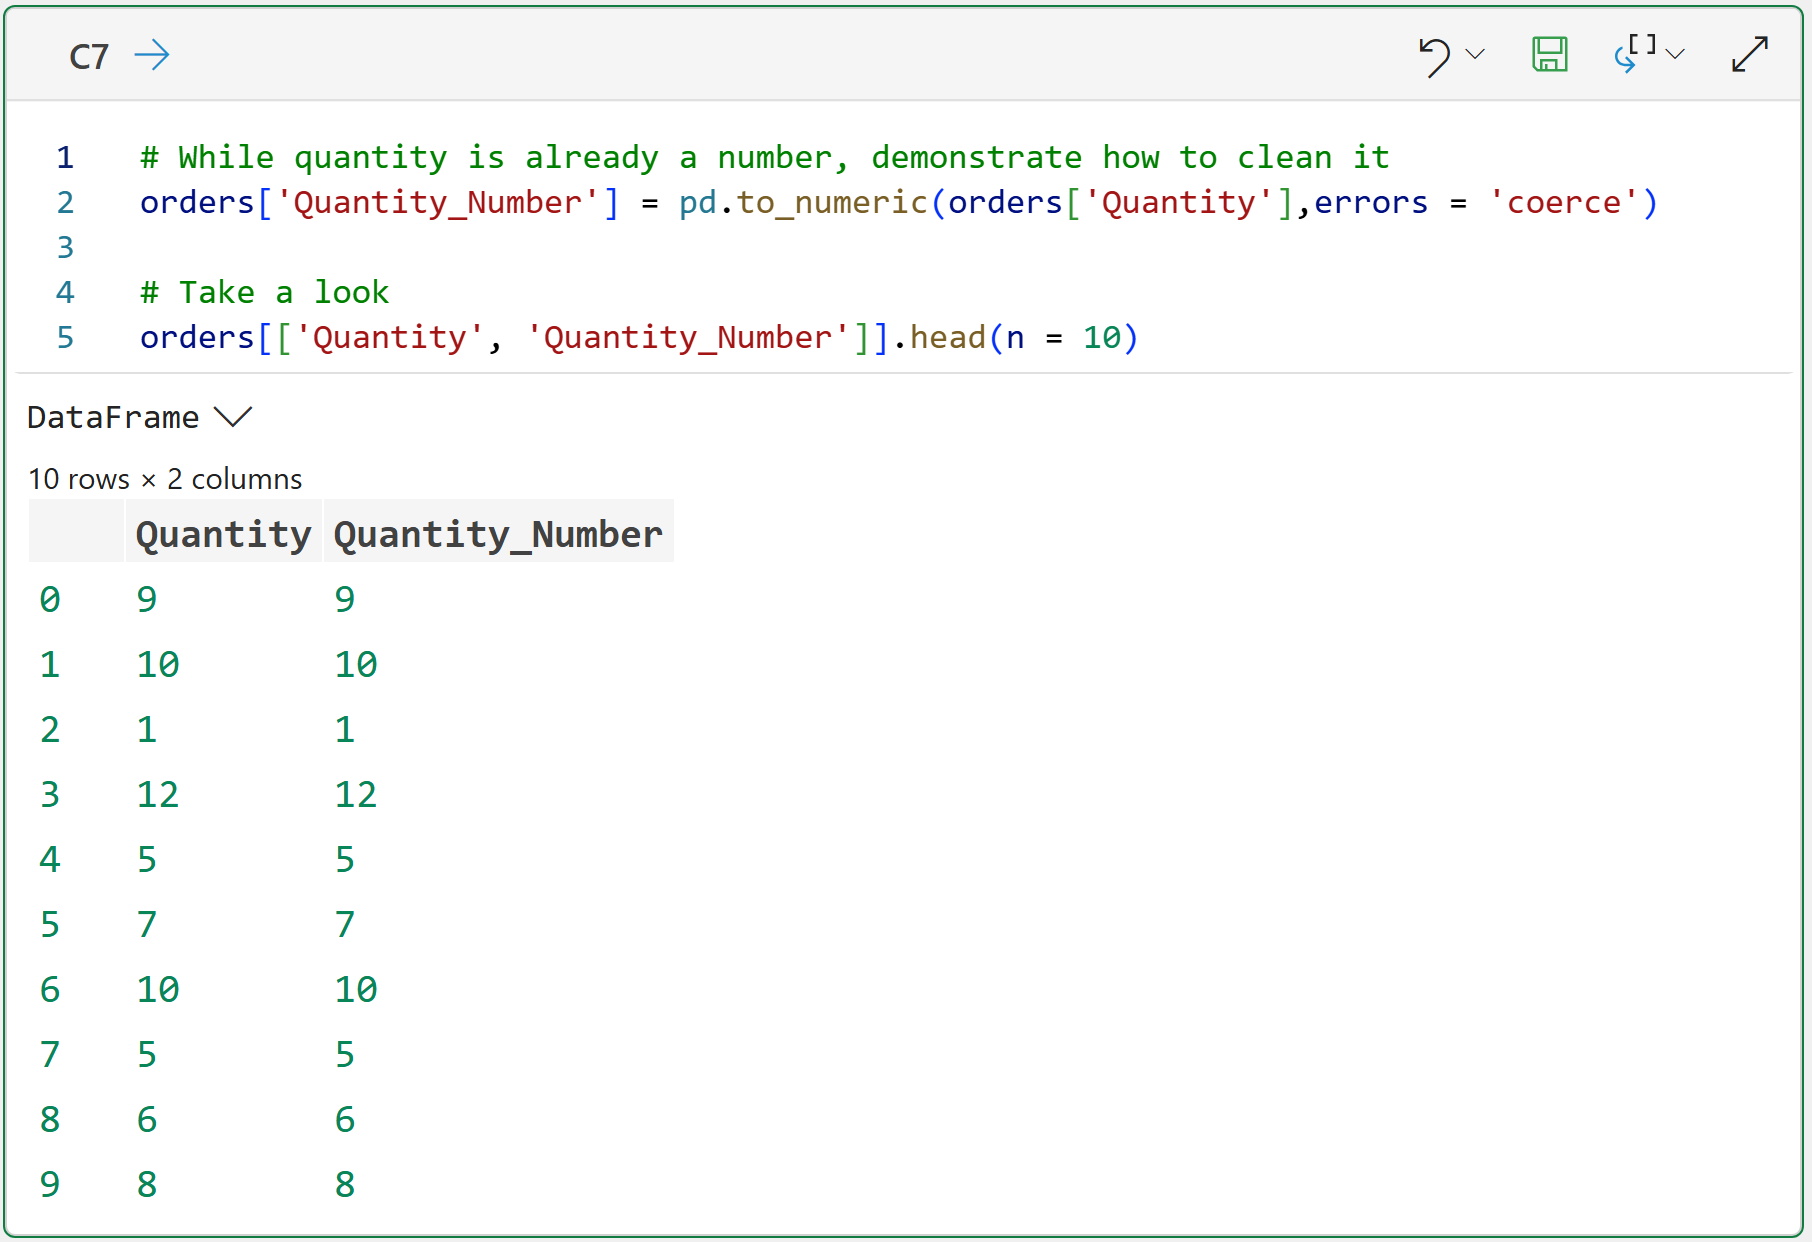
Think of the new column Quantity_Number as the numeric version of Quantity. You might be thinking:
"Why create a new column instead of replacing the old one immediately?"
Because you are still learning and validating. Keeping both columns side by side lets you compare the original value to the converted value.
In the code above, the argument errors = 'coerce' is important. It means:
If a value cannot be converted to a number, turn it into a missing value.
This is useful because it prevents the code from breaking. It also makes failed conversions easier for you to find.
Step 7: Find Quantity Values That Didn’t Convert
Here's how you find rows where Quantity was present but did not convert successfully:
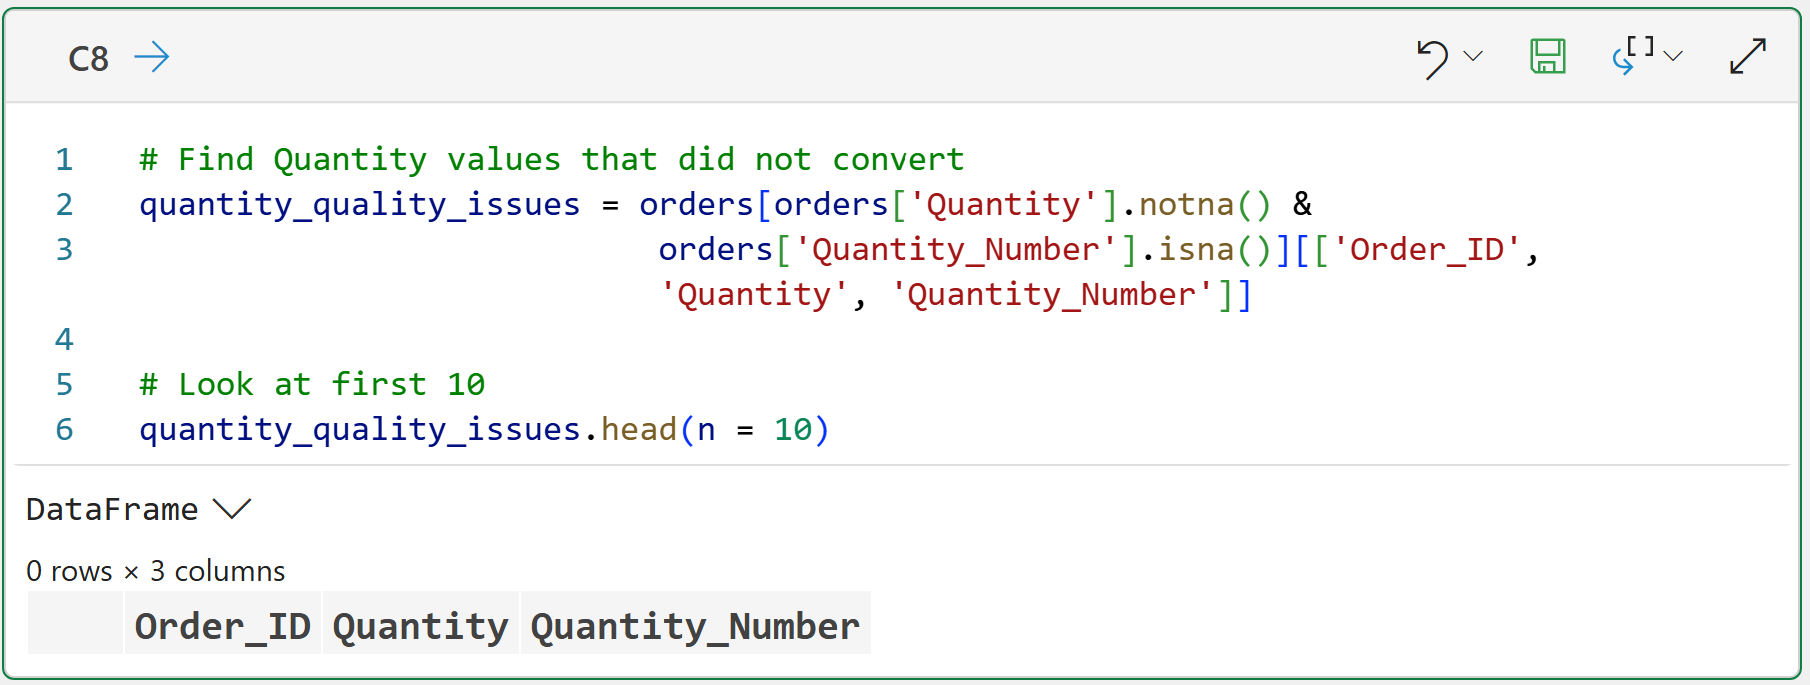
As you can see above, the Quantity column's dirty data consists only of missing values, which is why quantity_quality_issues is empty.
However, the code in this and the previous step is a useful pattern for you to use with any numeric column, as you will see in the next two steps.
Step 8: Clean Currency Columns Before Converting
The Unit_Price and Order_Total columns are more complicated.
They may contain values such as:
$125.00
1,250.00
USD 89.99
unknown
Python cannot directly convert these to numbers. First, you need to remove formatting characters. A small utility function will be useful for this:
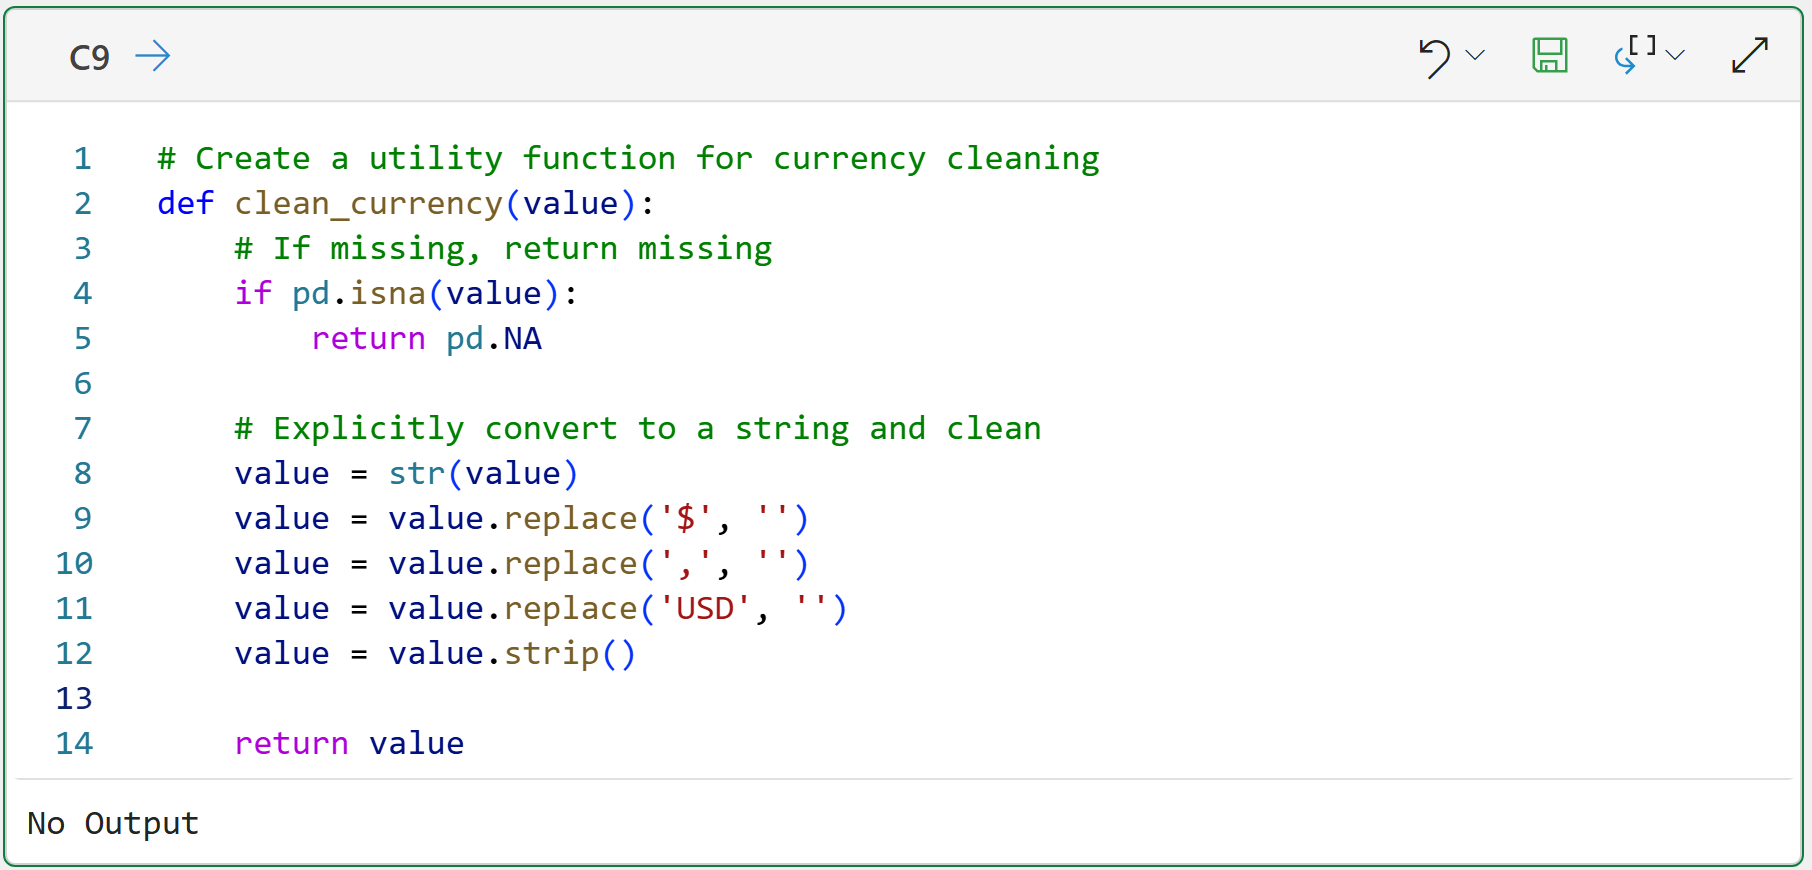
This function does not fully clean and validate the currency value that's passed in. It only removes common currency formatting but shows you a useful pattern for writing reusable data-cleaning code in your projects.
Here's how you apply the utility function to the Unit_Price column:
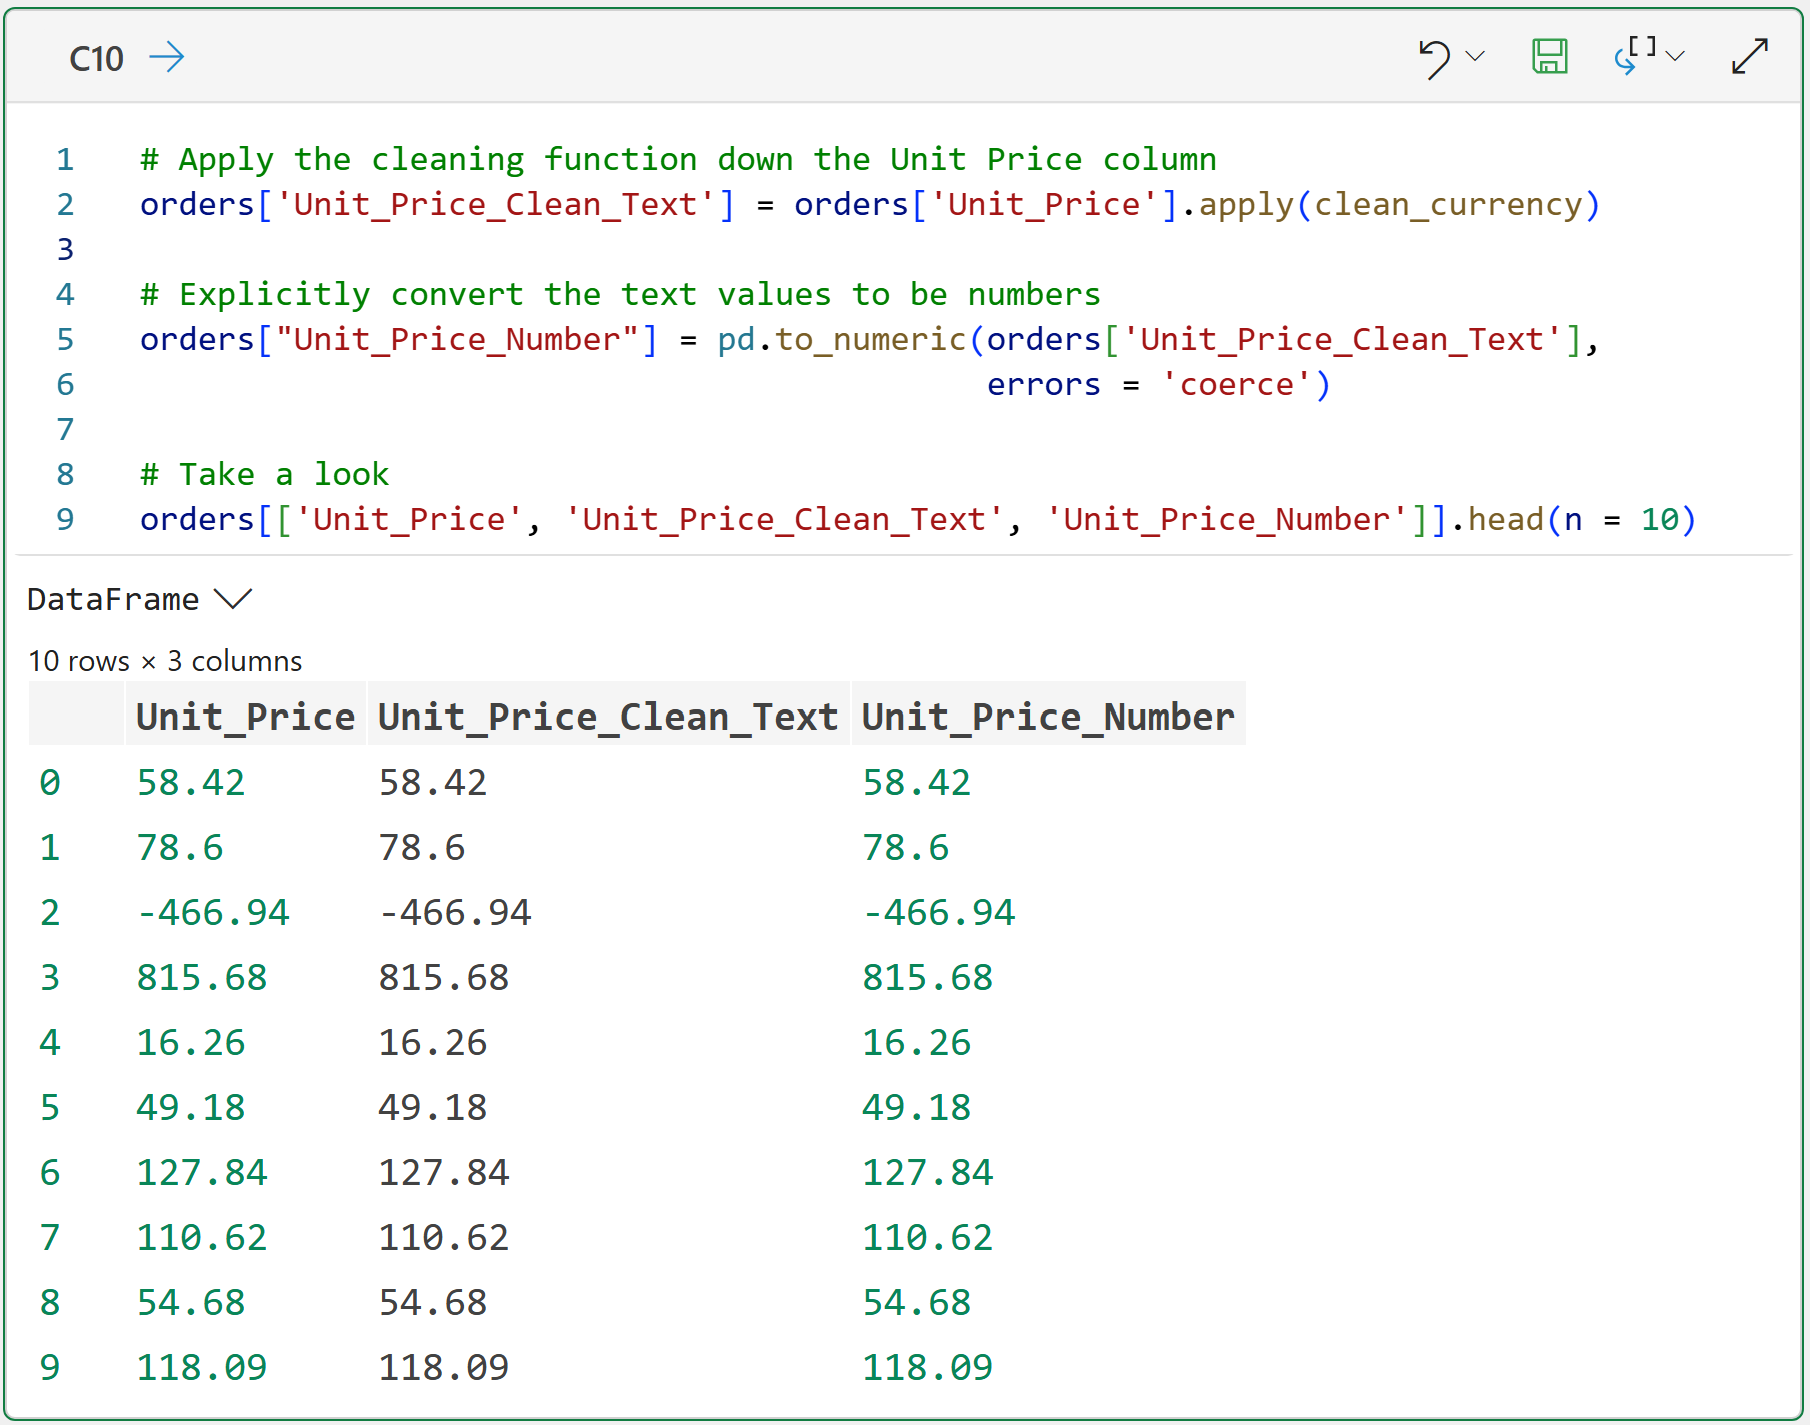
As you can see in cell C10's output, the first 10 rows of data look good, but don't worry. There's dirty data in the Unit_Price column that's not being displayed.
You should repeat this code pattern for the Order_Total column:
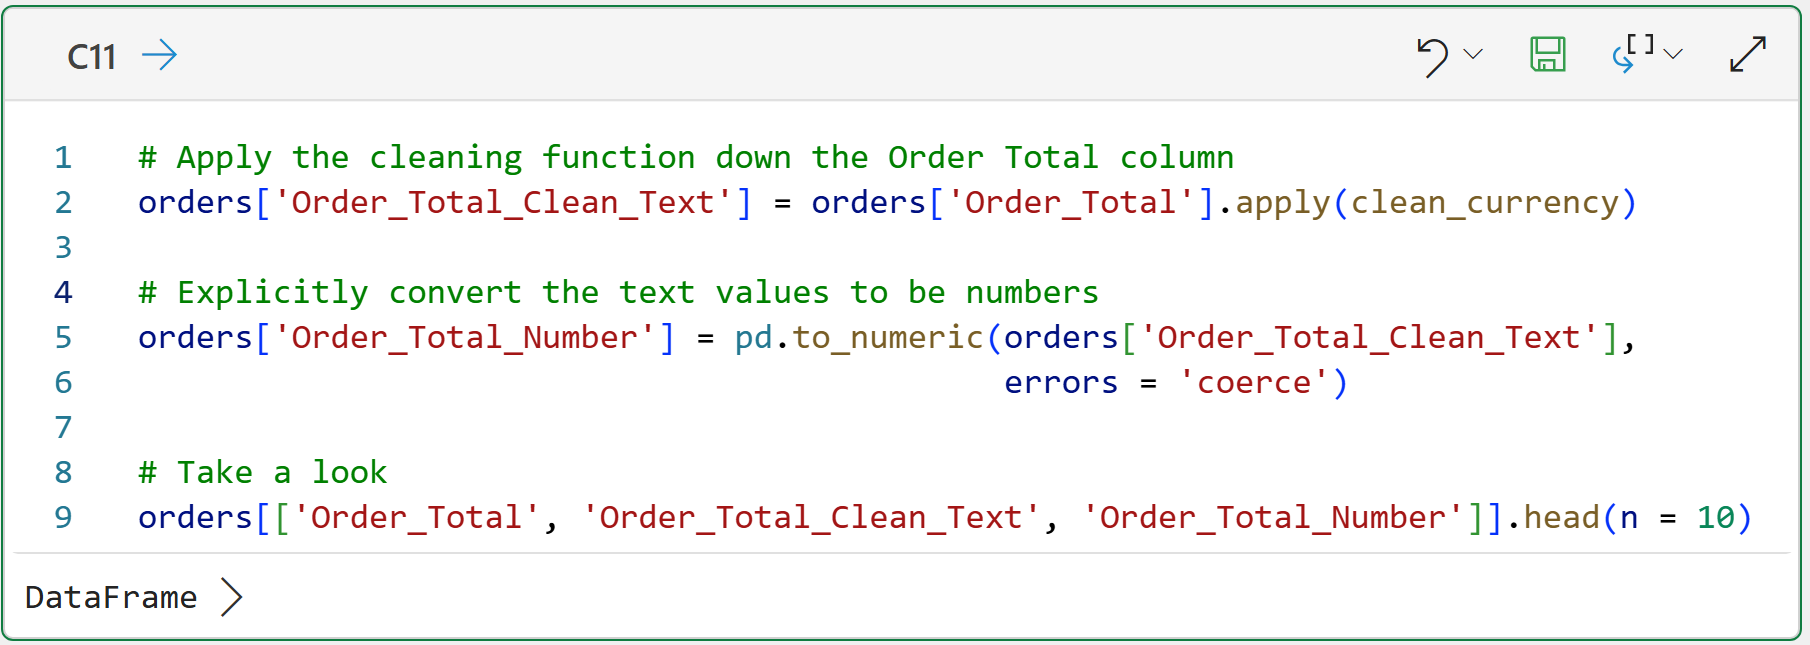
This is a good example of the difference between format cleaning and business validation:
Removing dollar signs and commas is format cleaning.
Deciding whether a negative price or an unusually large order total is valid is business validation.
You will handle this distinction more carefully in Part 4.
Step 9: Find Currency Values That Didn’t Convert
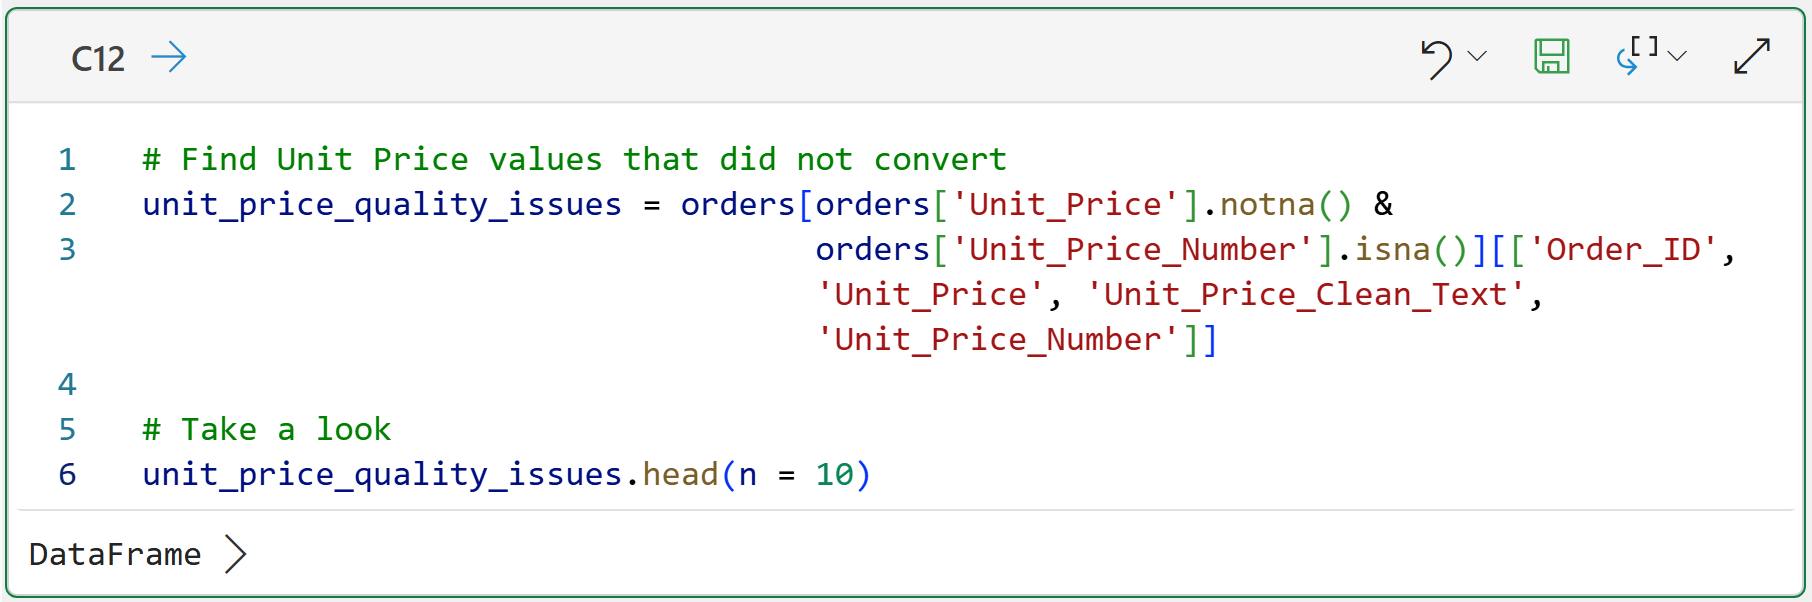
Here's the code to check for currency values that failed to convert after cleaning:
And the DataFrame card for cell C12's output:
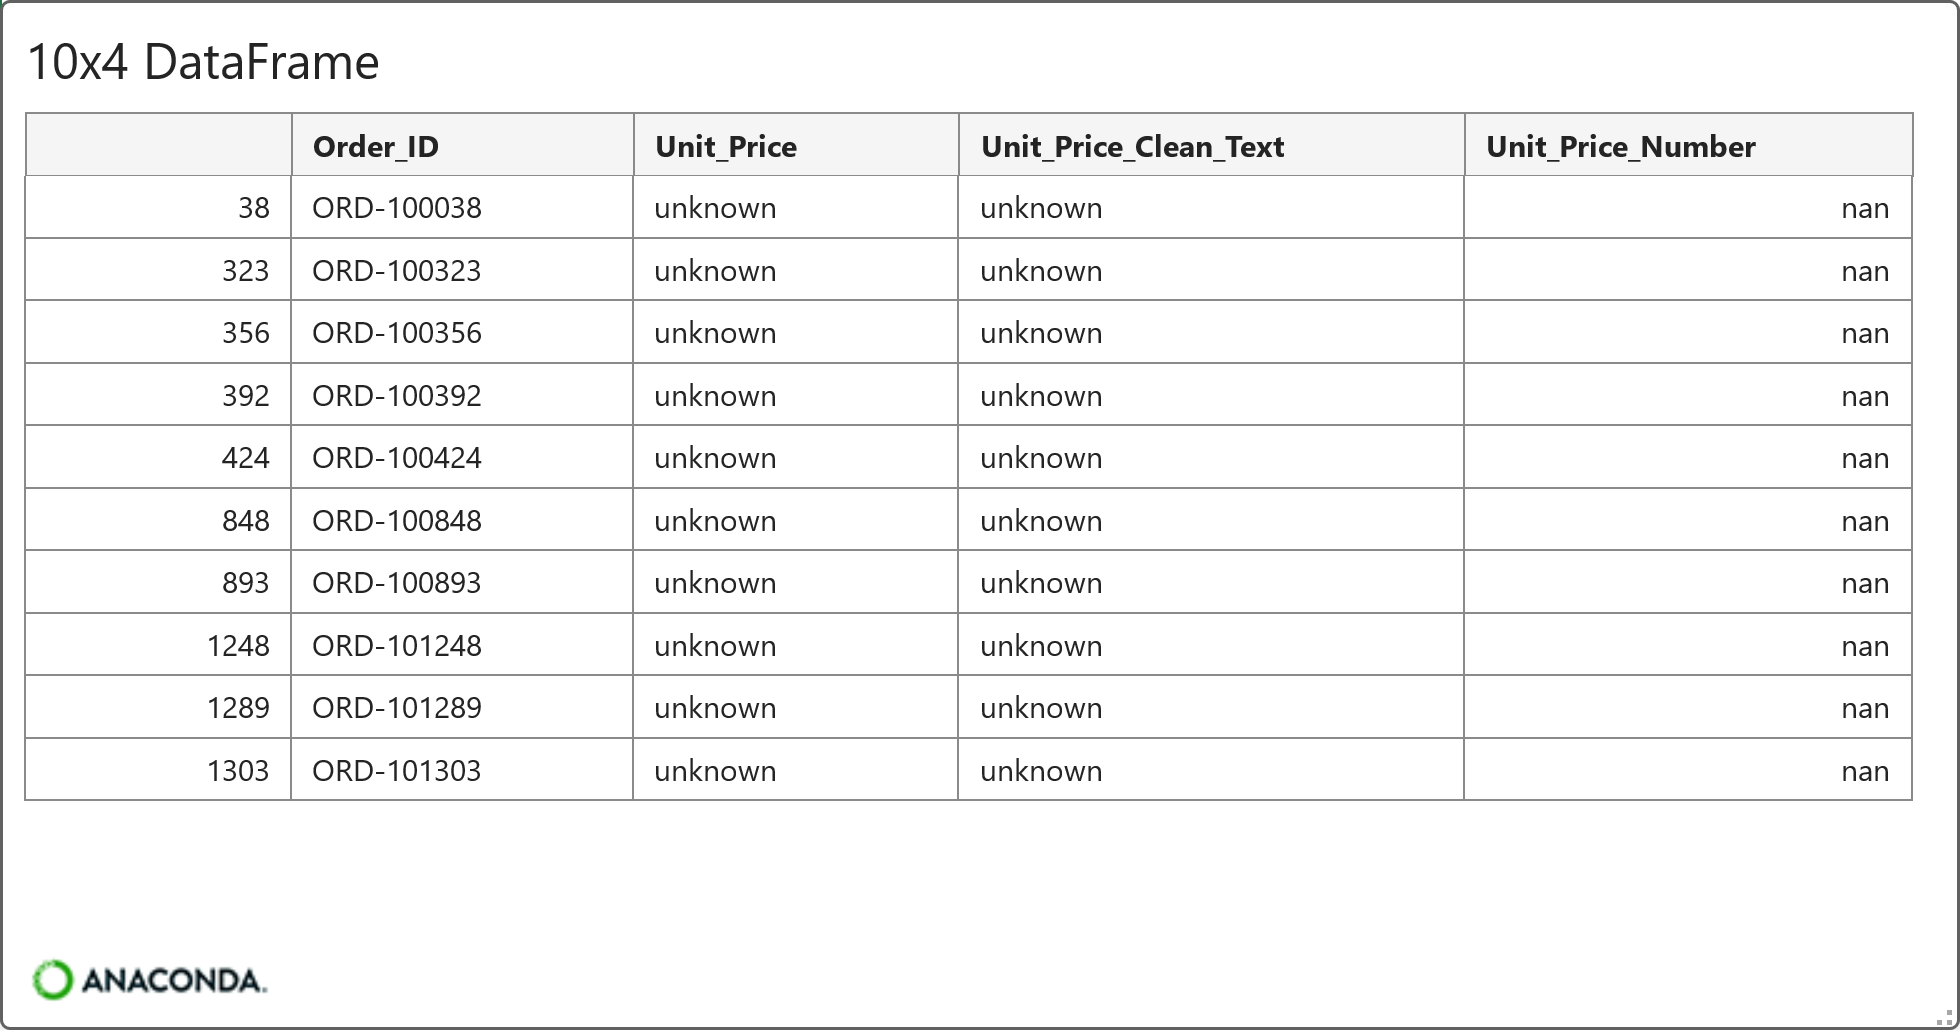
BTW - If you're not familiar with Python, the value of nan stands for "Not a Number." It's one of the ways the pandas library represents a missing value.
And for the Order_Total:
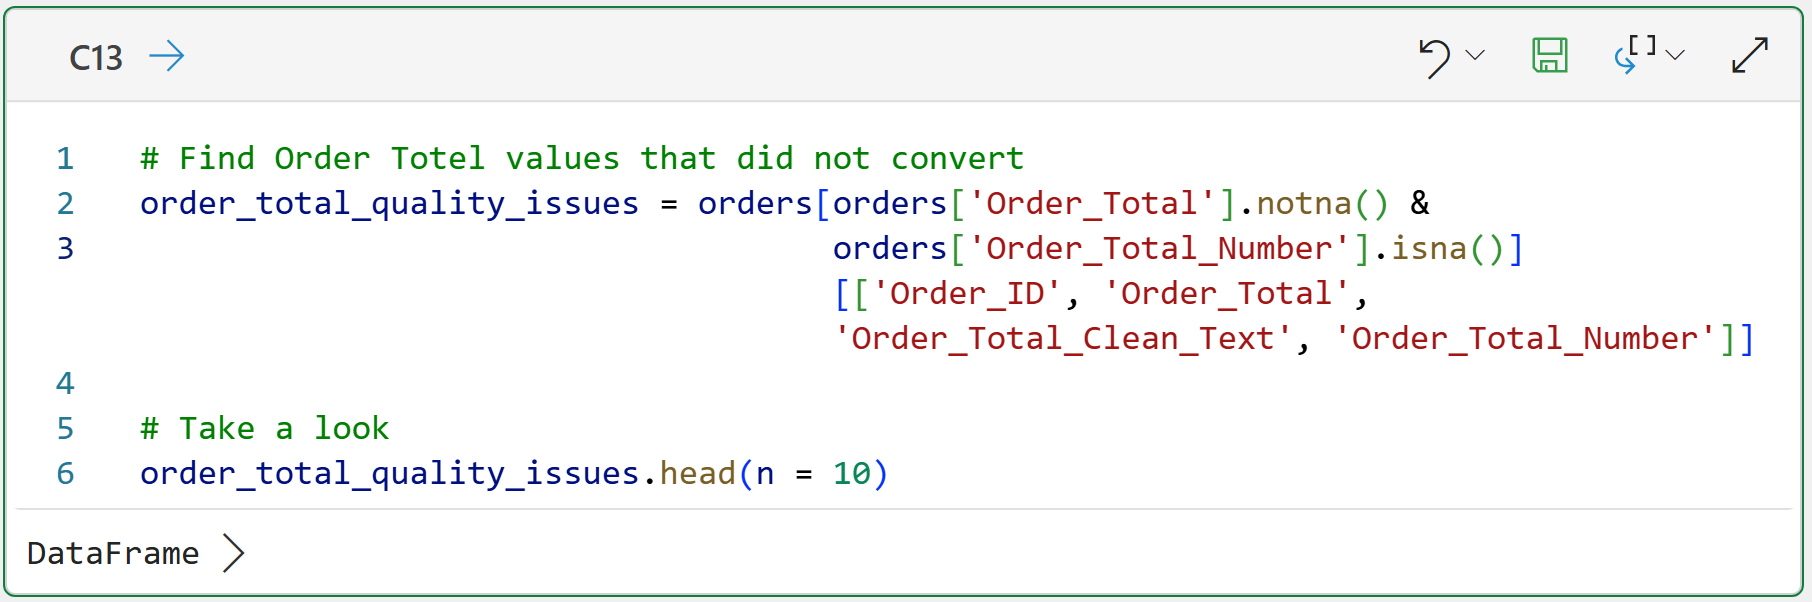
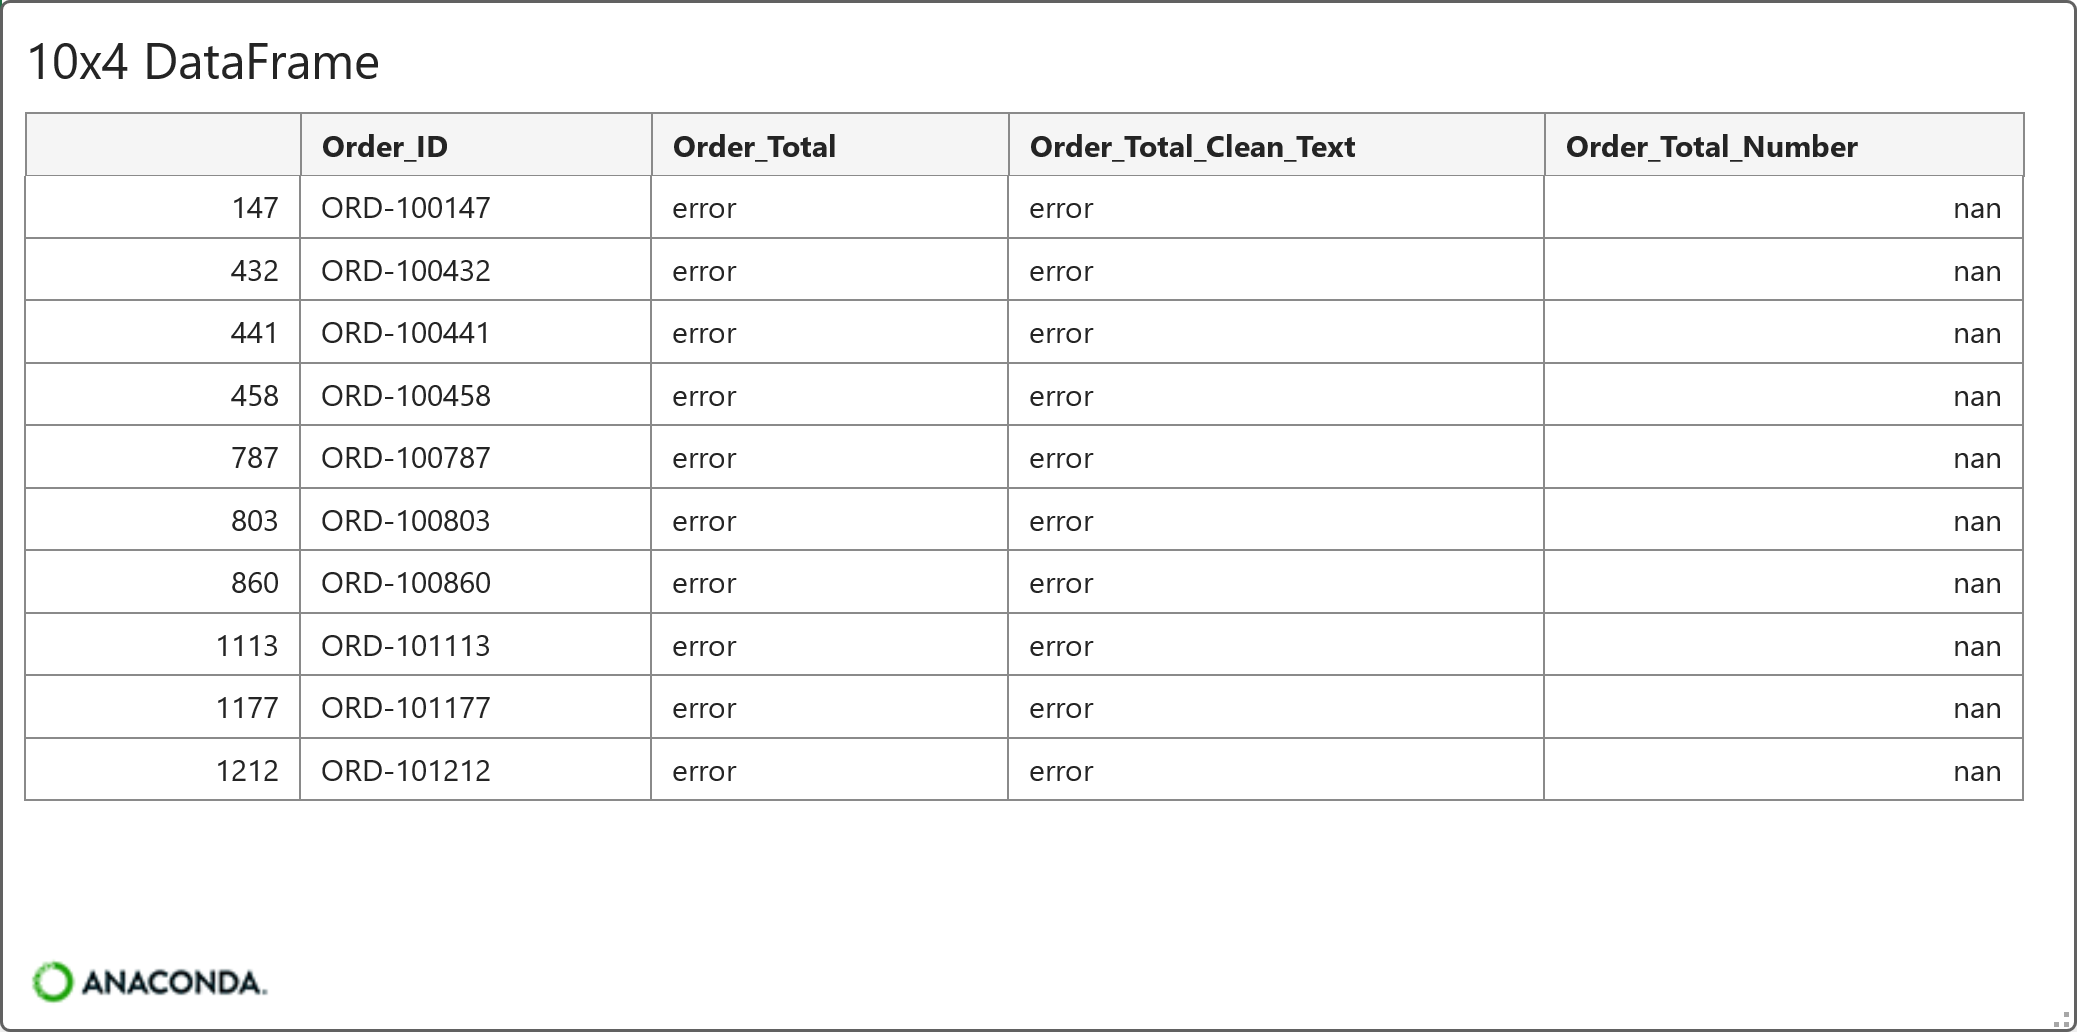
In the cards above, you see values unknown and error. This is useful information for you. The conversion did not silently pretend those values were numbers.
Instead, it turned them into missing values so you can inspect them later.
Step 10: Convert Discount to a Consistent Number
The Discount column is tricky because it may contain values in multiple styles. For example:
0.10
10%
none
For analysis, you usually want the discount to be stored as a decimal. For example:
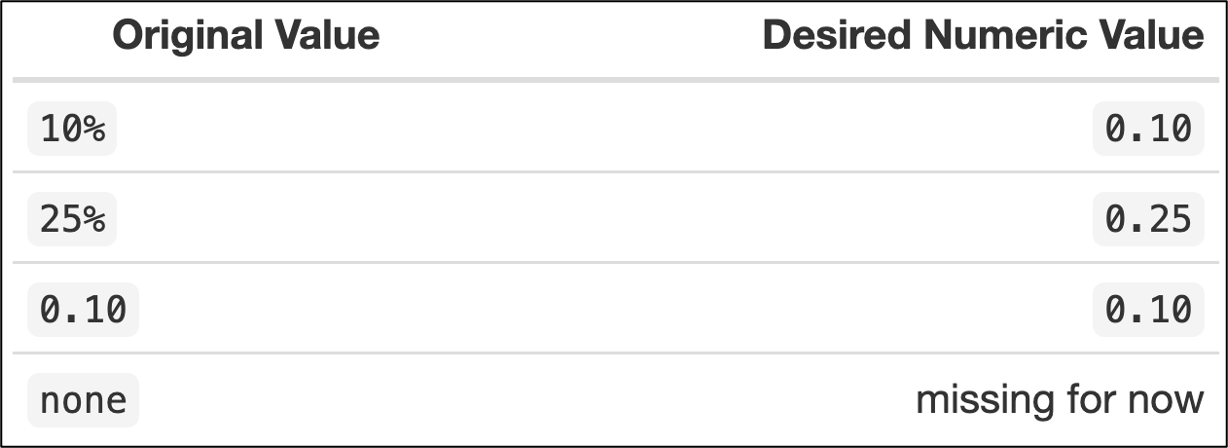
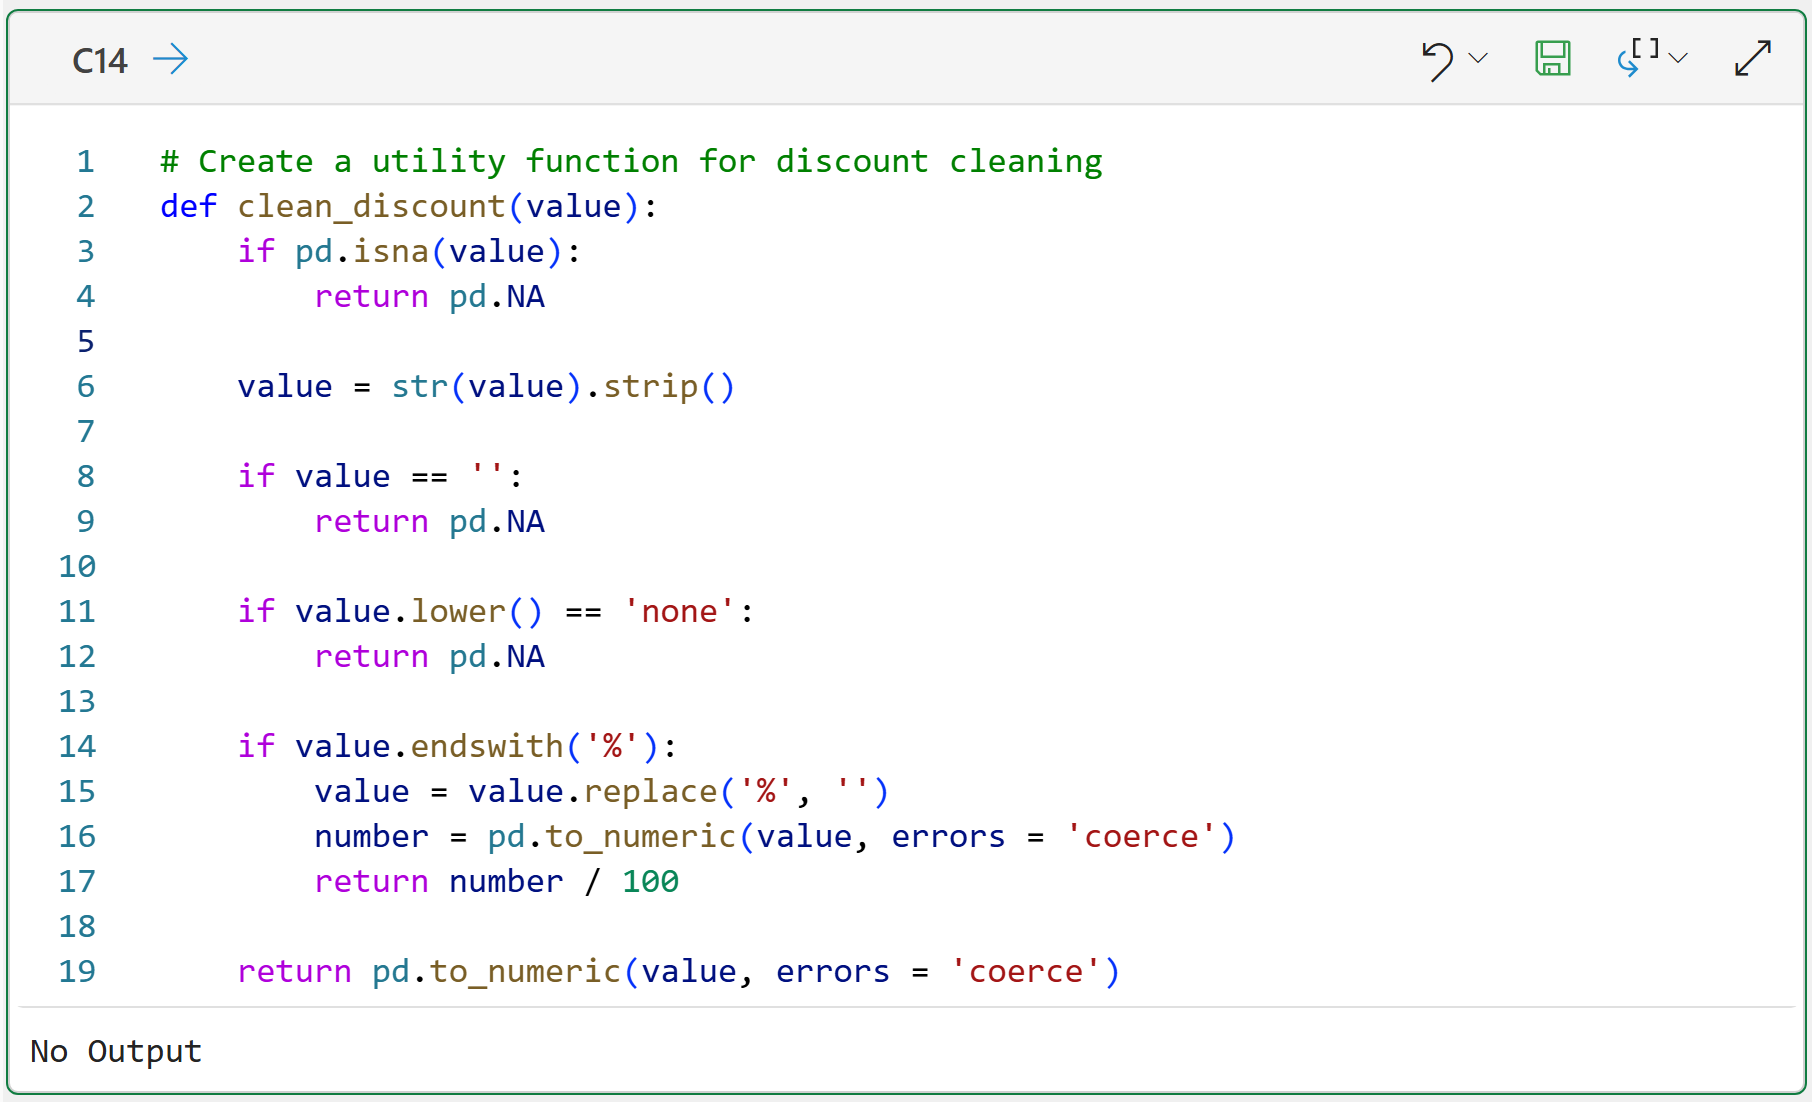
Once again, a utility function for cleaning discounts is helpful:
And to apply it to the Discount column:
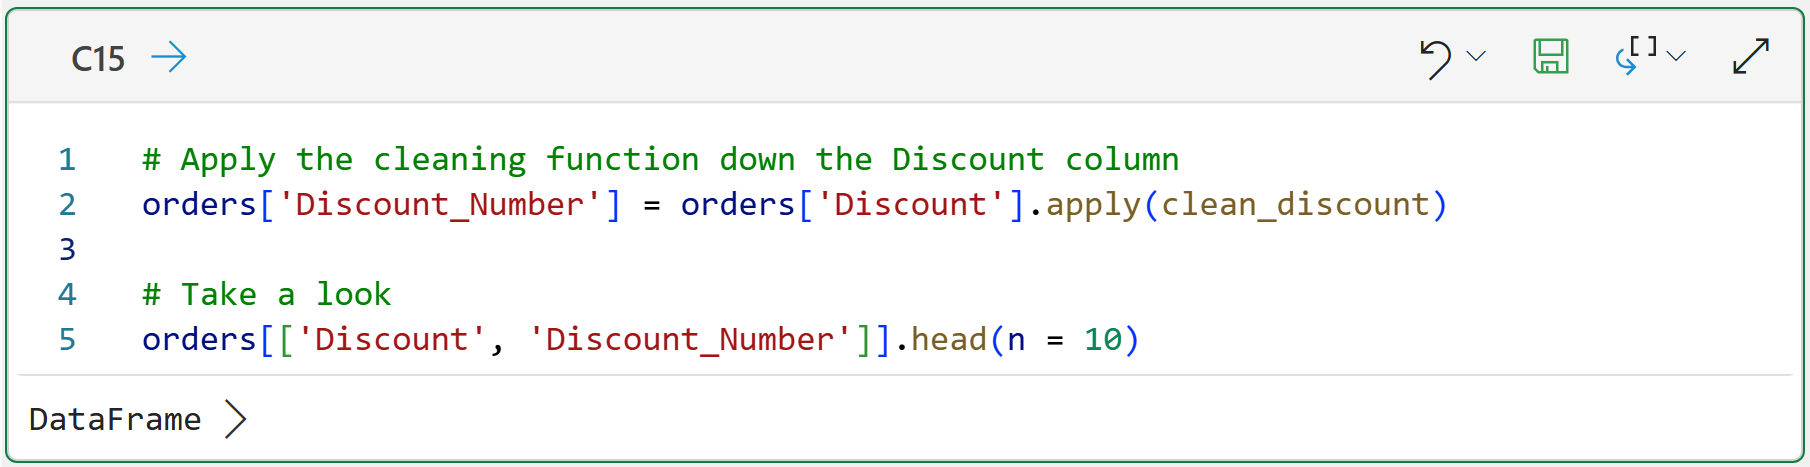
This is the first example where conversion requires a little interpretation.
The value 10% should not be converted to 10. It should become 0.10.
That is why discounts deserve their own cleaning logic.
Step 11: Find Discount Values That Didn’t Convert
As usual, you should inspect discount values that didn't convert:
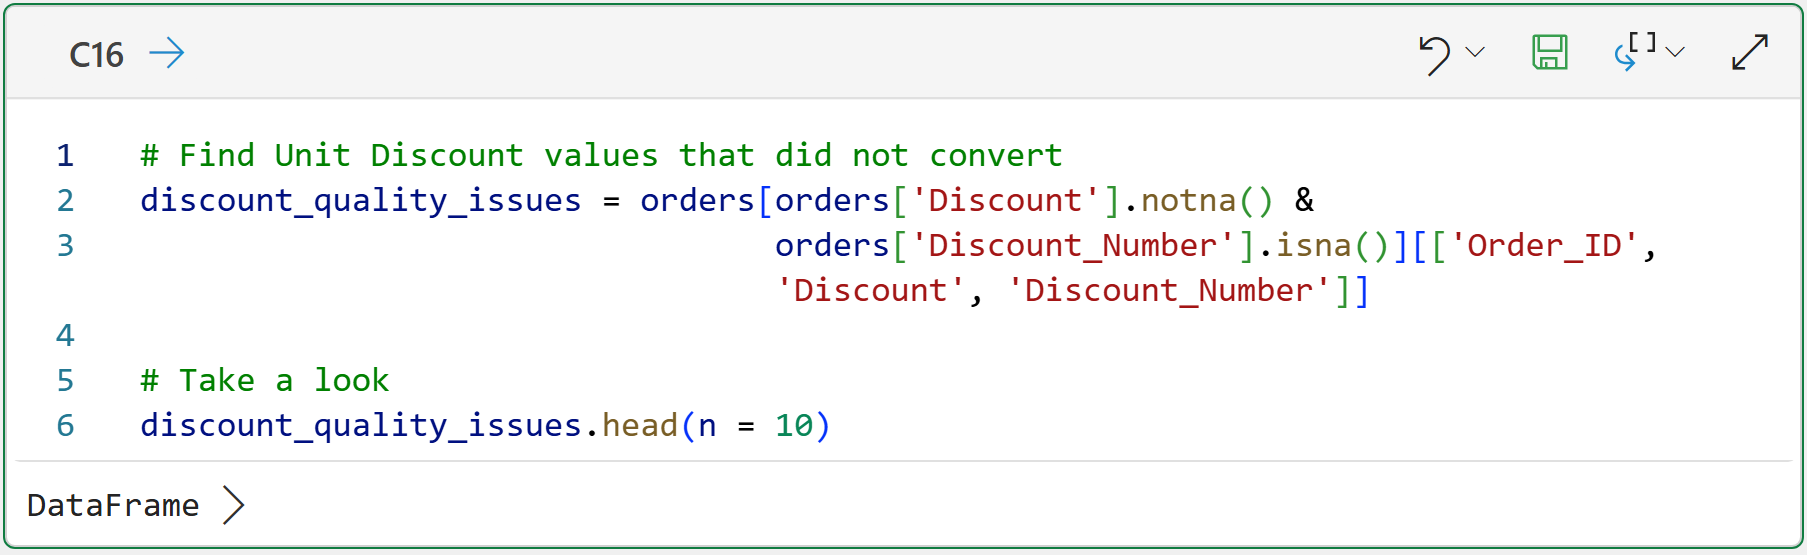
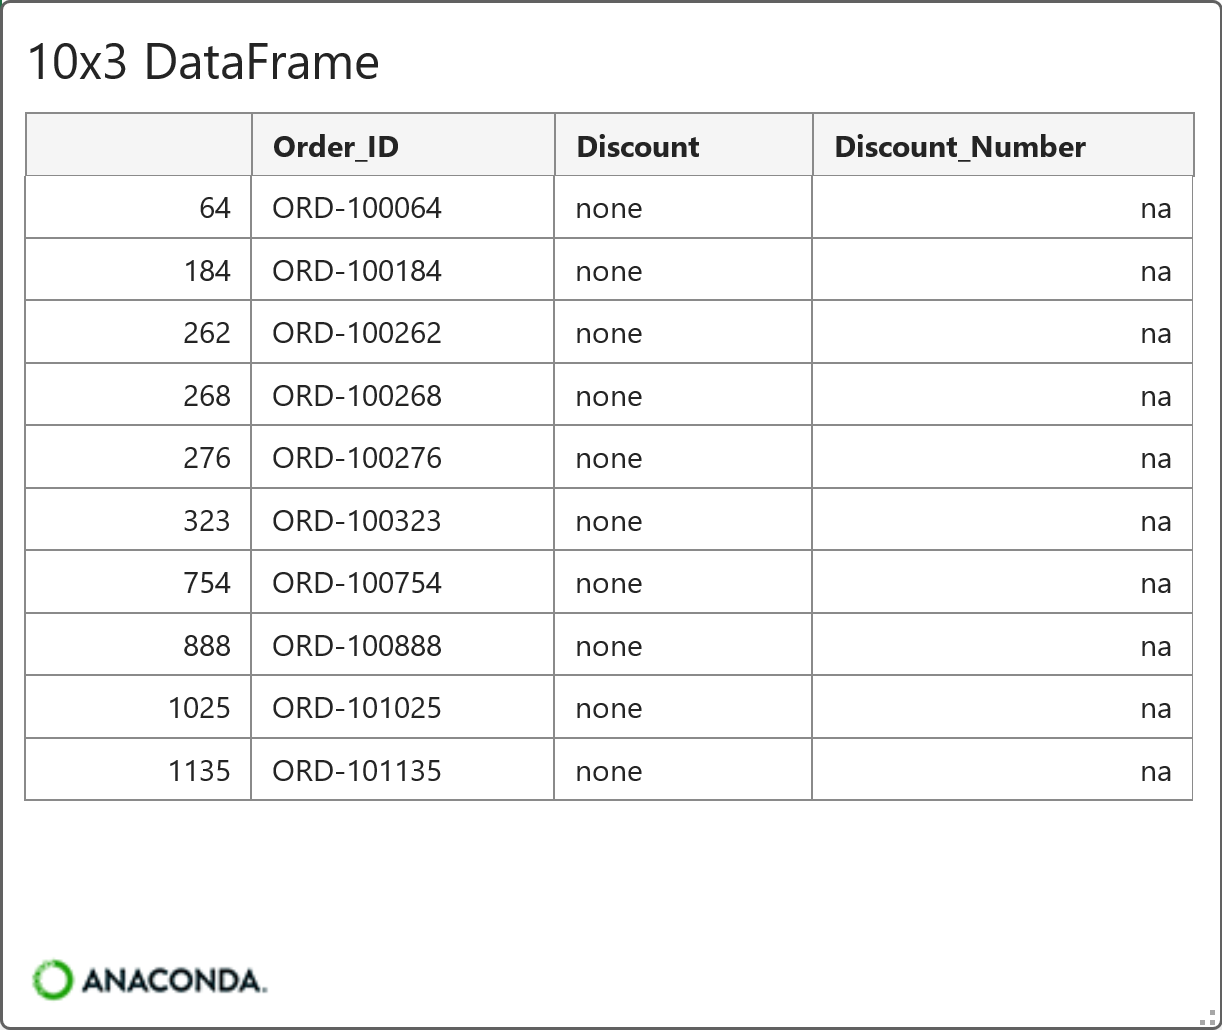
BTW - As you might have guessed, pandas uses the value of na ("Not Available") to also represent missing values.
Some of these may be expected. For example, if the original value was none, you intentionally converted it to missing for now.
In Part 3, I will discuss whether missing discounts should remain missing or be set to zero.
That is a missing-data decision, not just a data type decision.
Step 12: Convert Date-Looking Columns
It's time to convert the date-looking columns. The dataset contains two date-time columns:
Order_Date
Ship_Date
Here's the code to convert them:
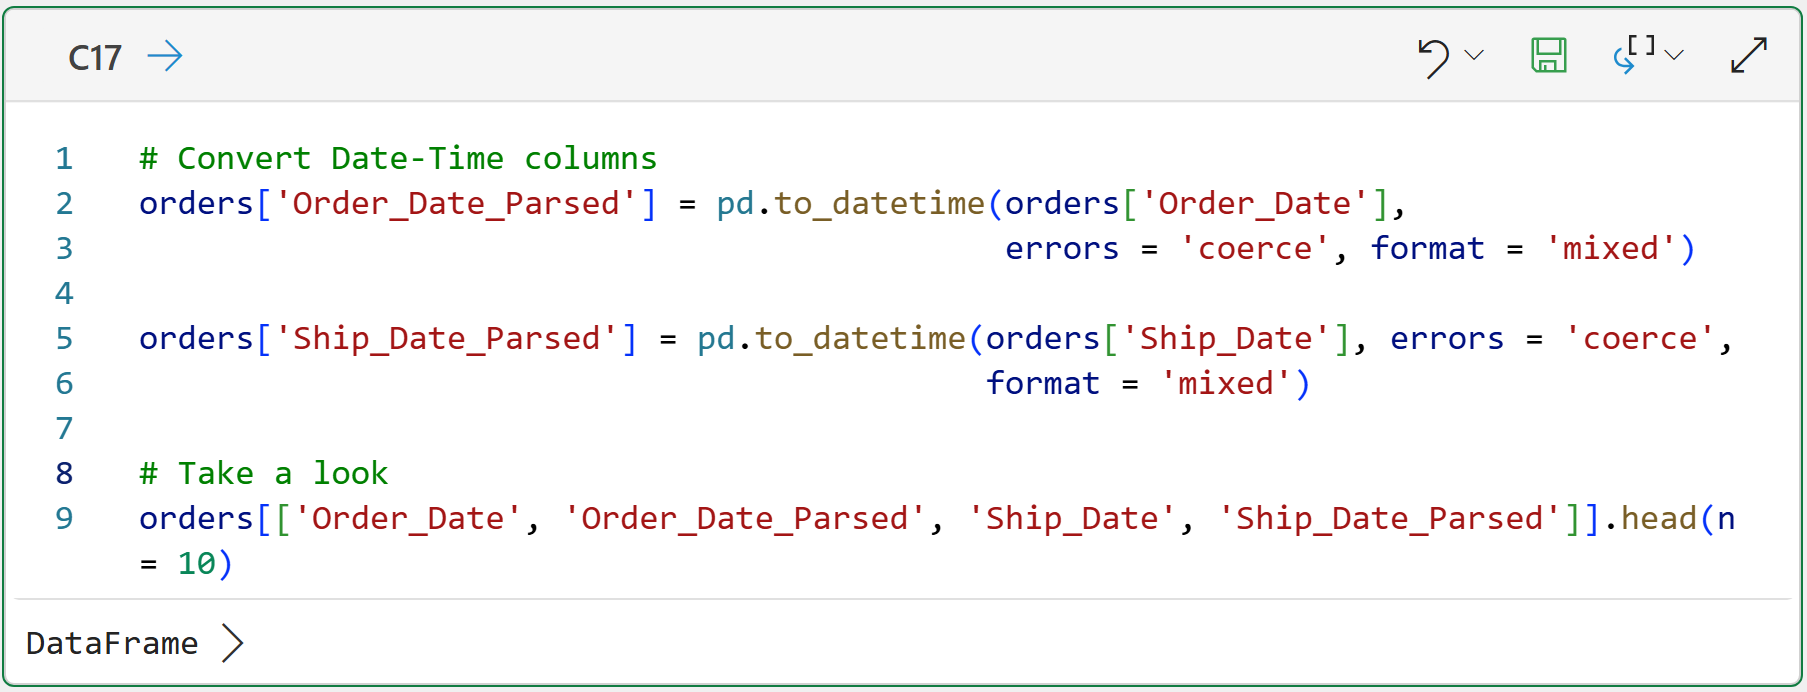
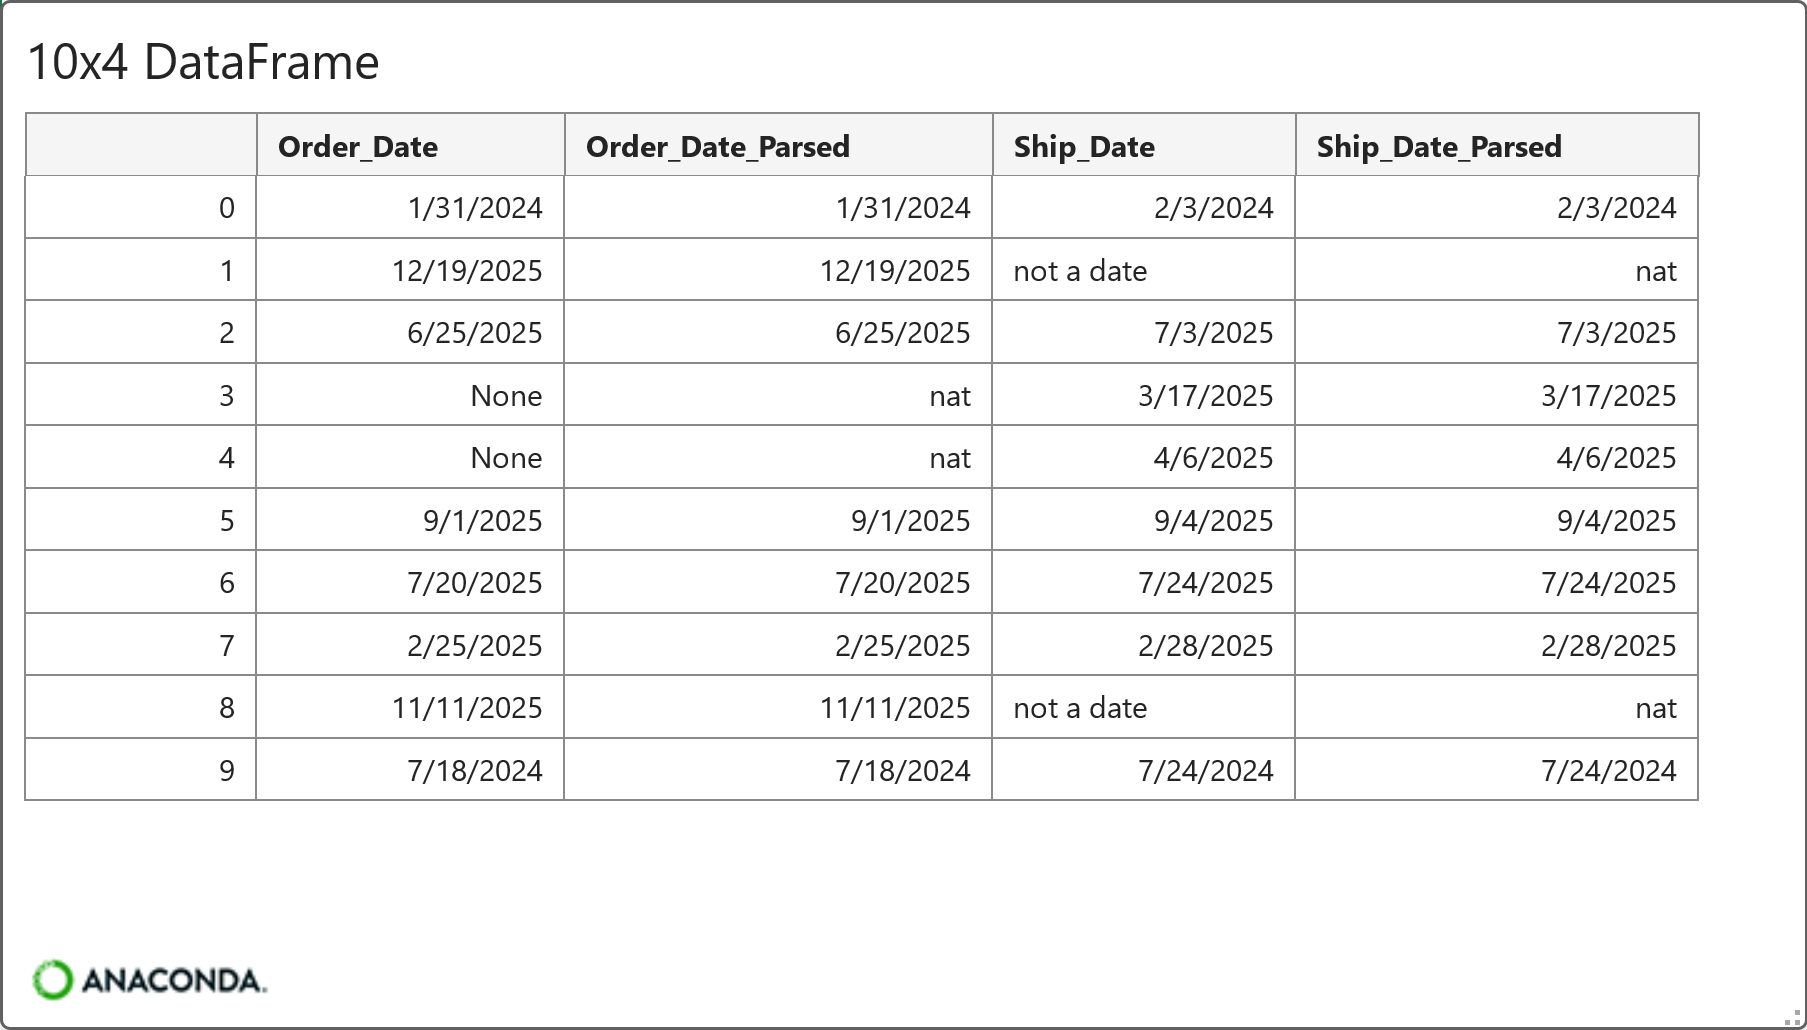
BTW - pandas uses the value of nat ("Not a Time") to also represent missing values.
Again, errors = 'coerce' is important. If pandas cannot parse a date, the result becomes missing.
This helps you find the rows that need attention.
Step 13: Find Date Values That Didn’t Convert
Time to inspect the dates that didn't get converted:
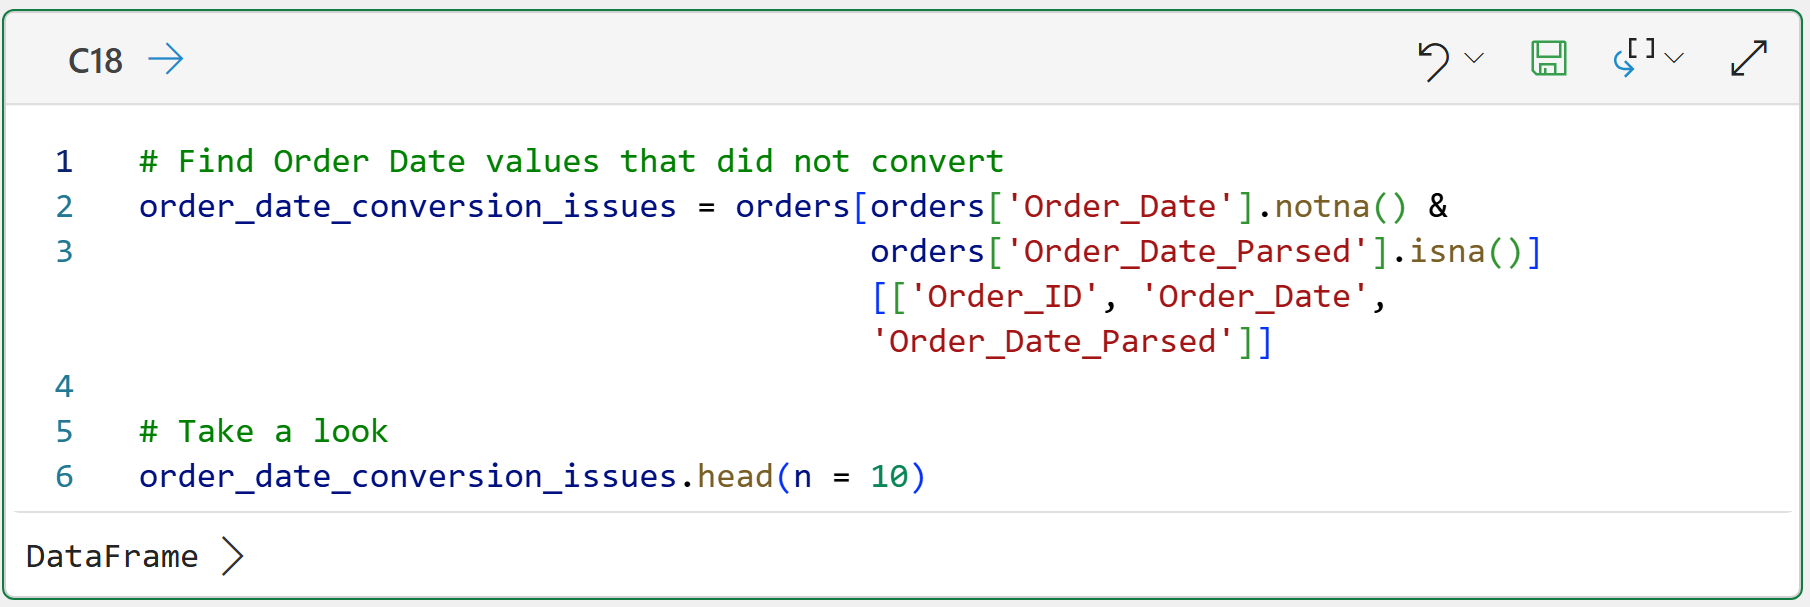
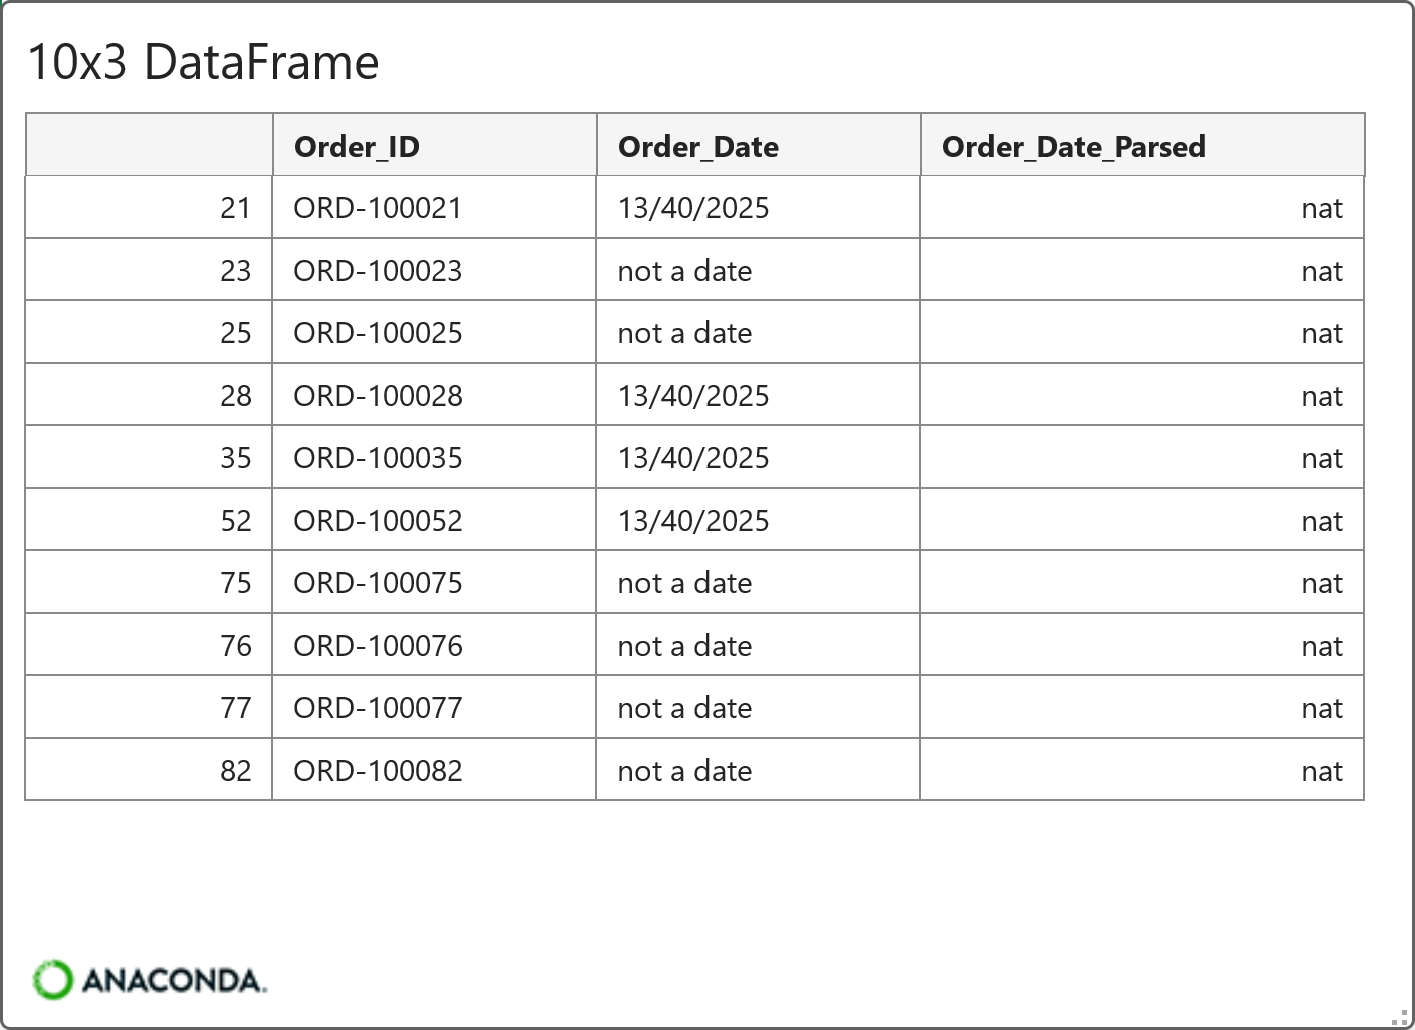
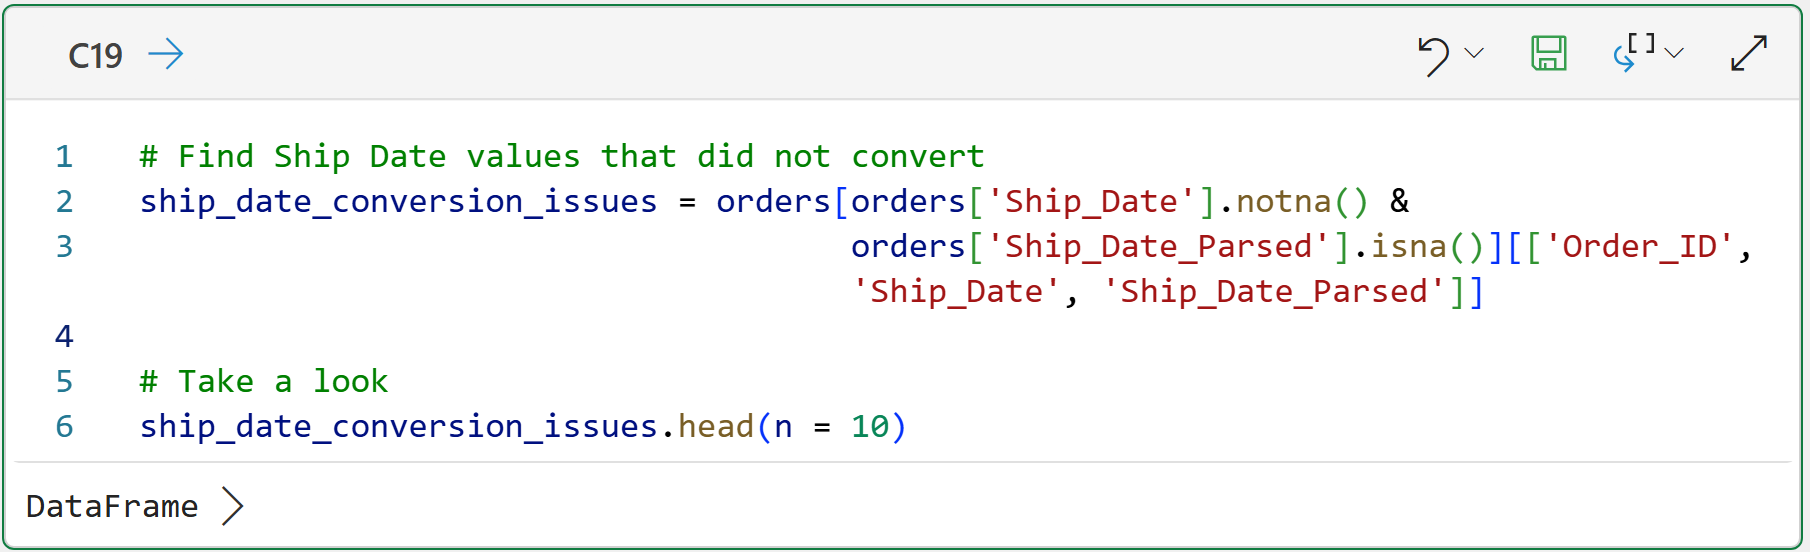
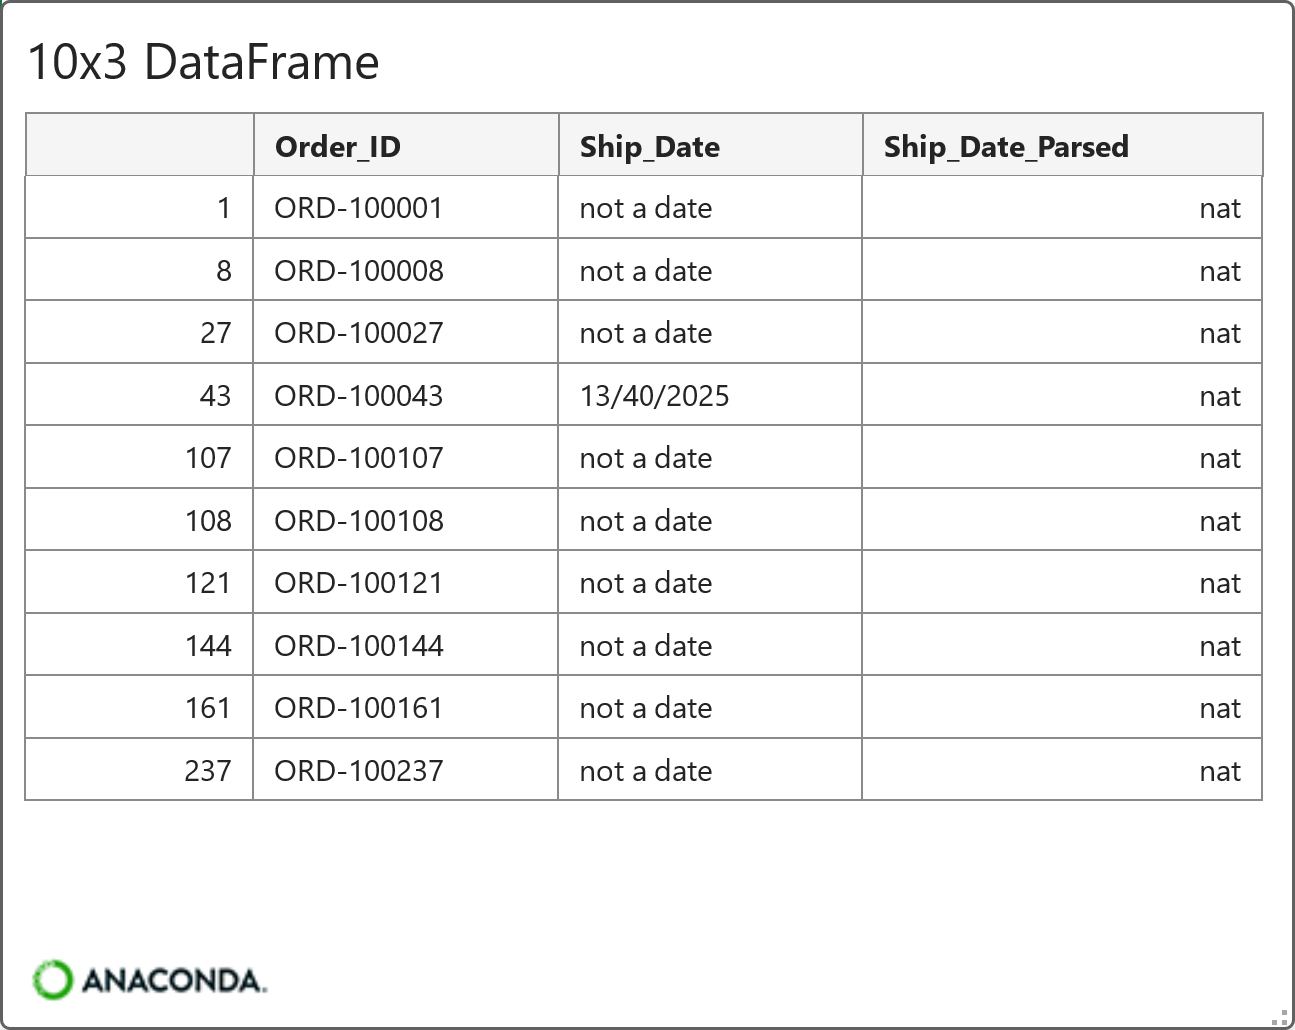
Some values may be invalid dates. Others may be placeholder text. For example:
not a date
13/40/2025
Those should not become real dates.
The goal of conversion is not to make bad values disappear. The goal is to separate values that can be parsed from values that need investigation.
This is another reason why having columns for the original and converted values is so useful - you can share them with business subject matter experts when you need help getting to why the data is as you see it.
Step 14: Converted Returned to a Cleaner yes/no Column
The Returned column is another common data typing problem. It may contain values such as:
Yes
Y
TRUE
1
No
N
FALSE
0
These values all represent a yes/no idea, but they are not stored consistently. So, it's time to create a cleaner returned flag:
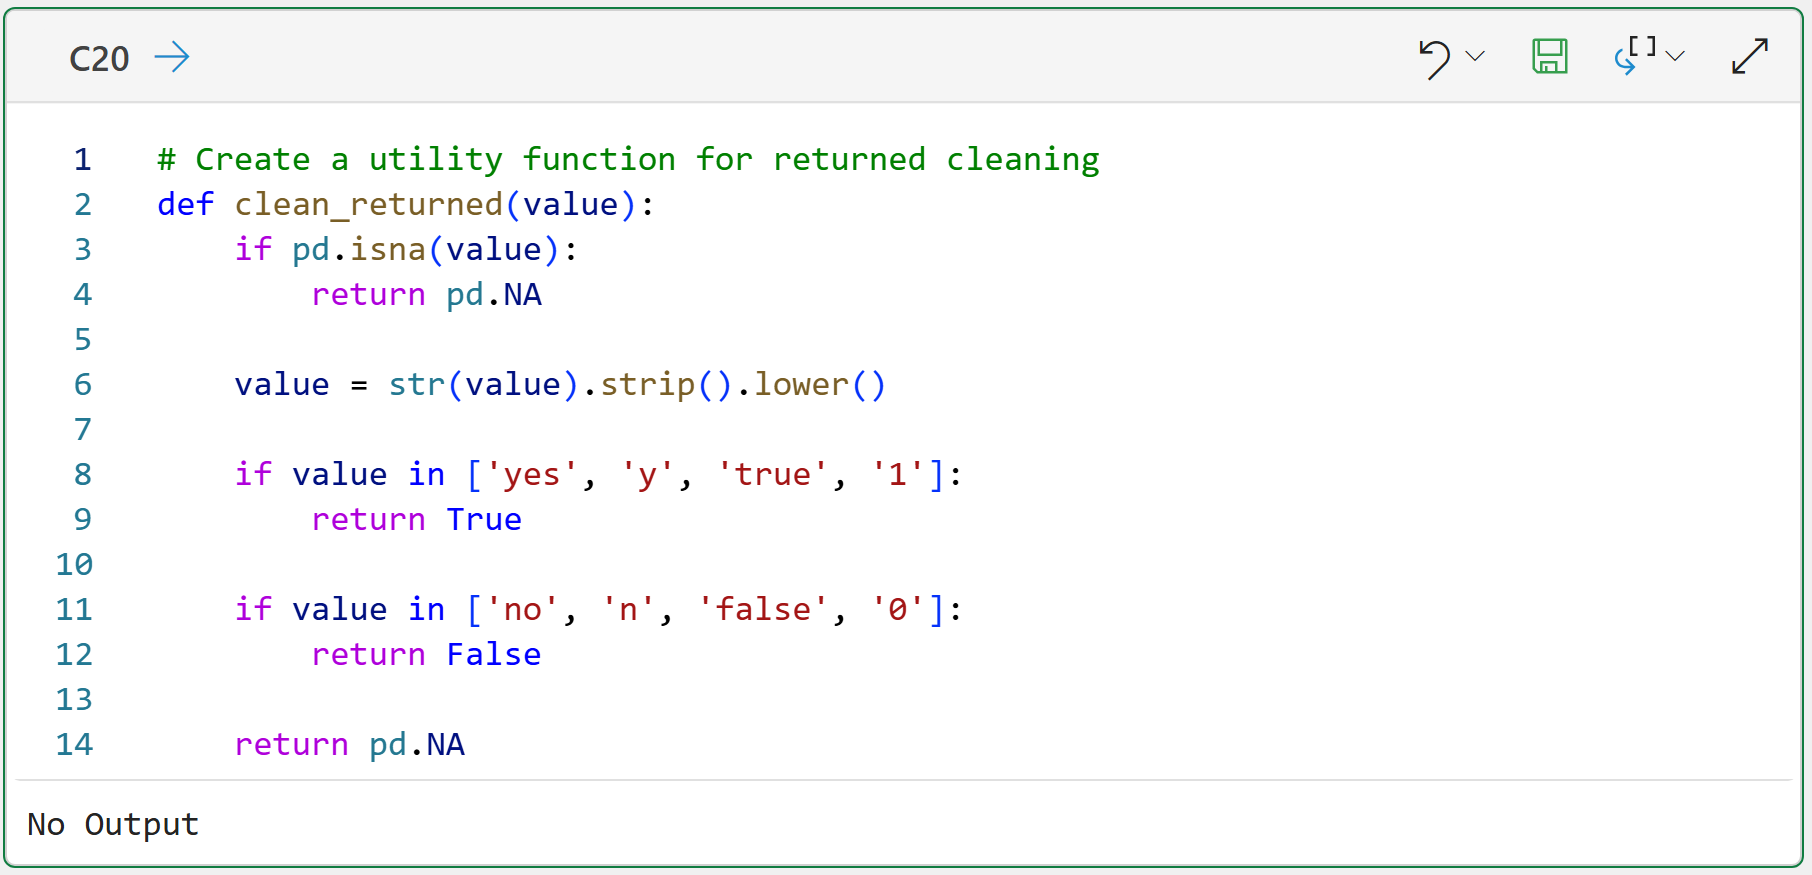
And to apply it to the Returned column:
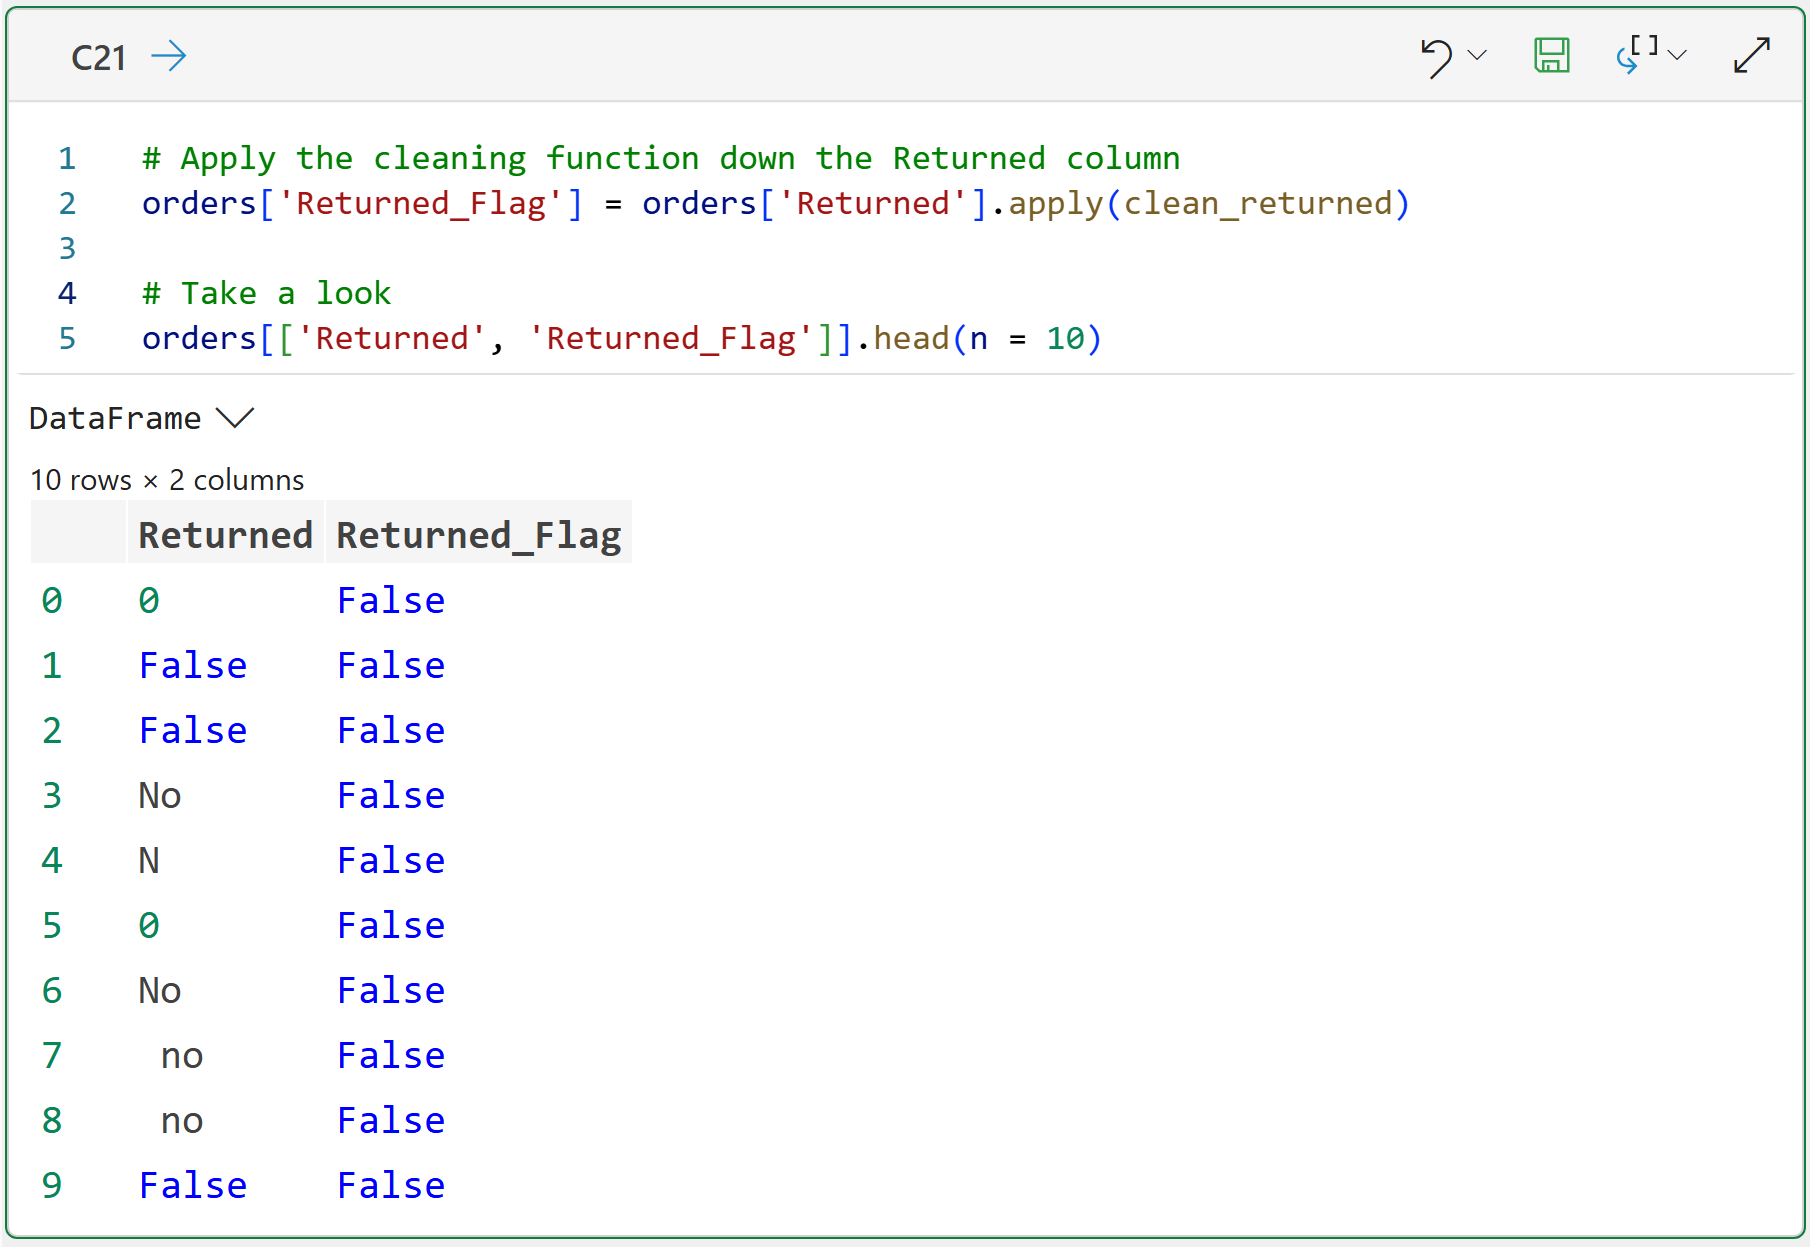
This gives you a cleaner Returned column for later analysis.
For example, once this field is cleaned, you can calculate the return rate much more easily.
Step 15: Create a Data Type Conversion Summary
Here's how you can summarize all of your work so far:
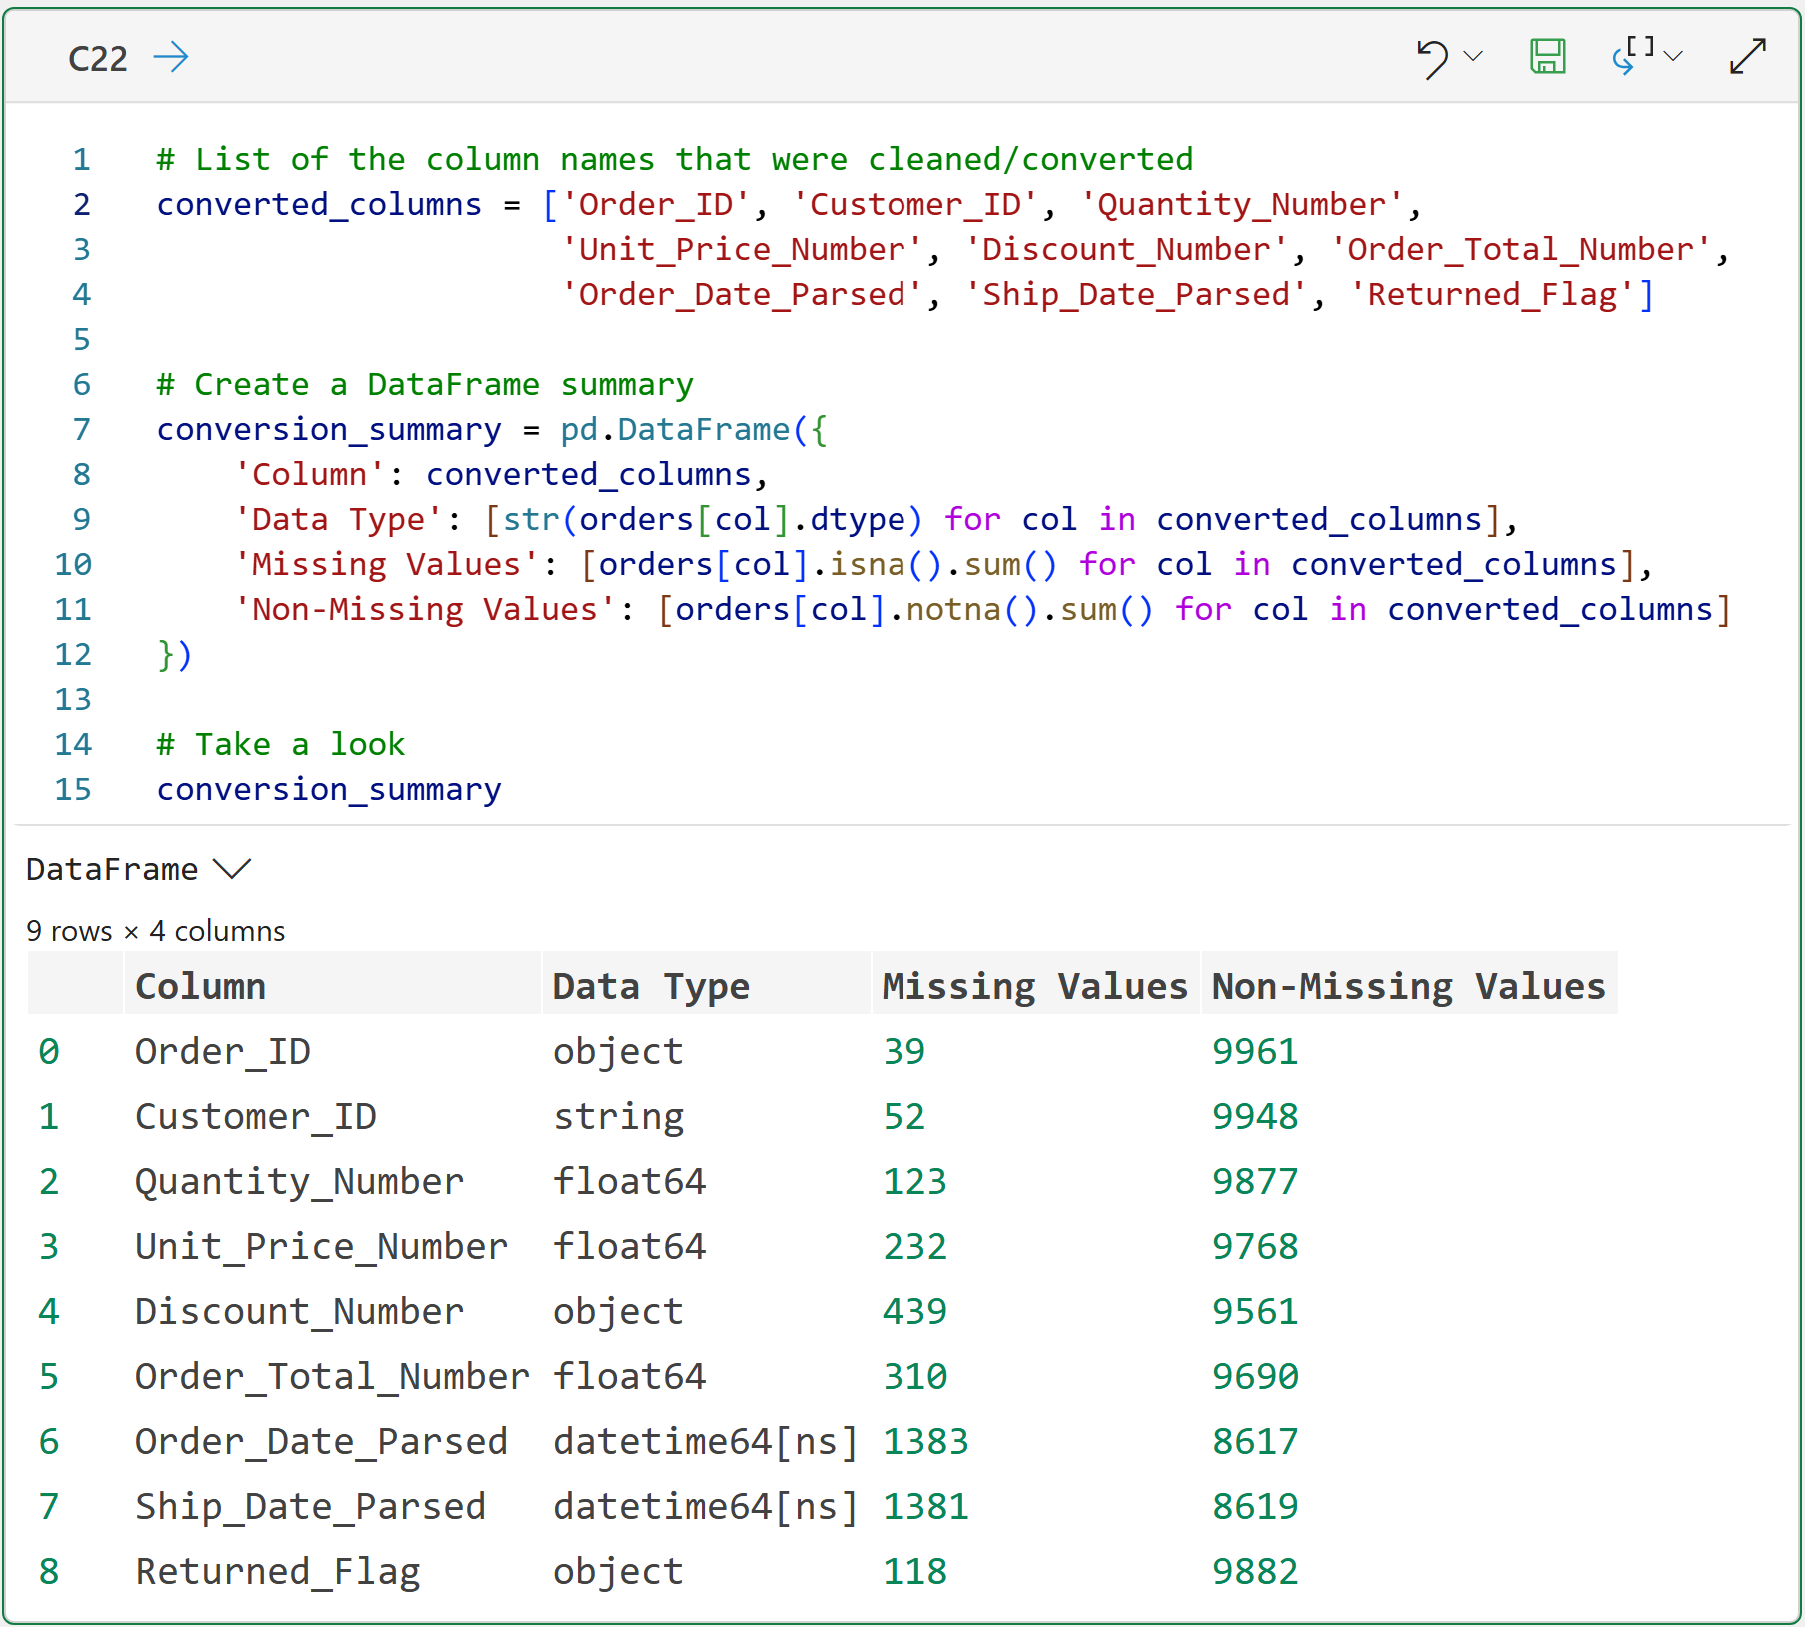
This DataFrame gives you a quick view of the converted fields. It also reminds you that conversions may create missing values.
That is not always bad. Often, it is exactly what you want.
A failed conversion is a signal that a value needs to be reviewed.
Step 16: Compare Data Type Before and After
Here's how you can create a before-and-after report for the work you've done in this tutorial:
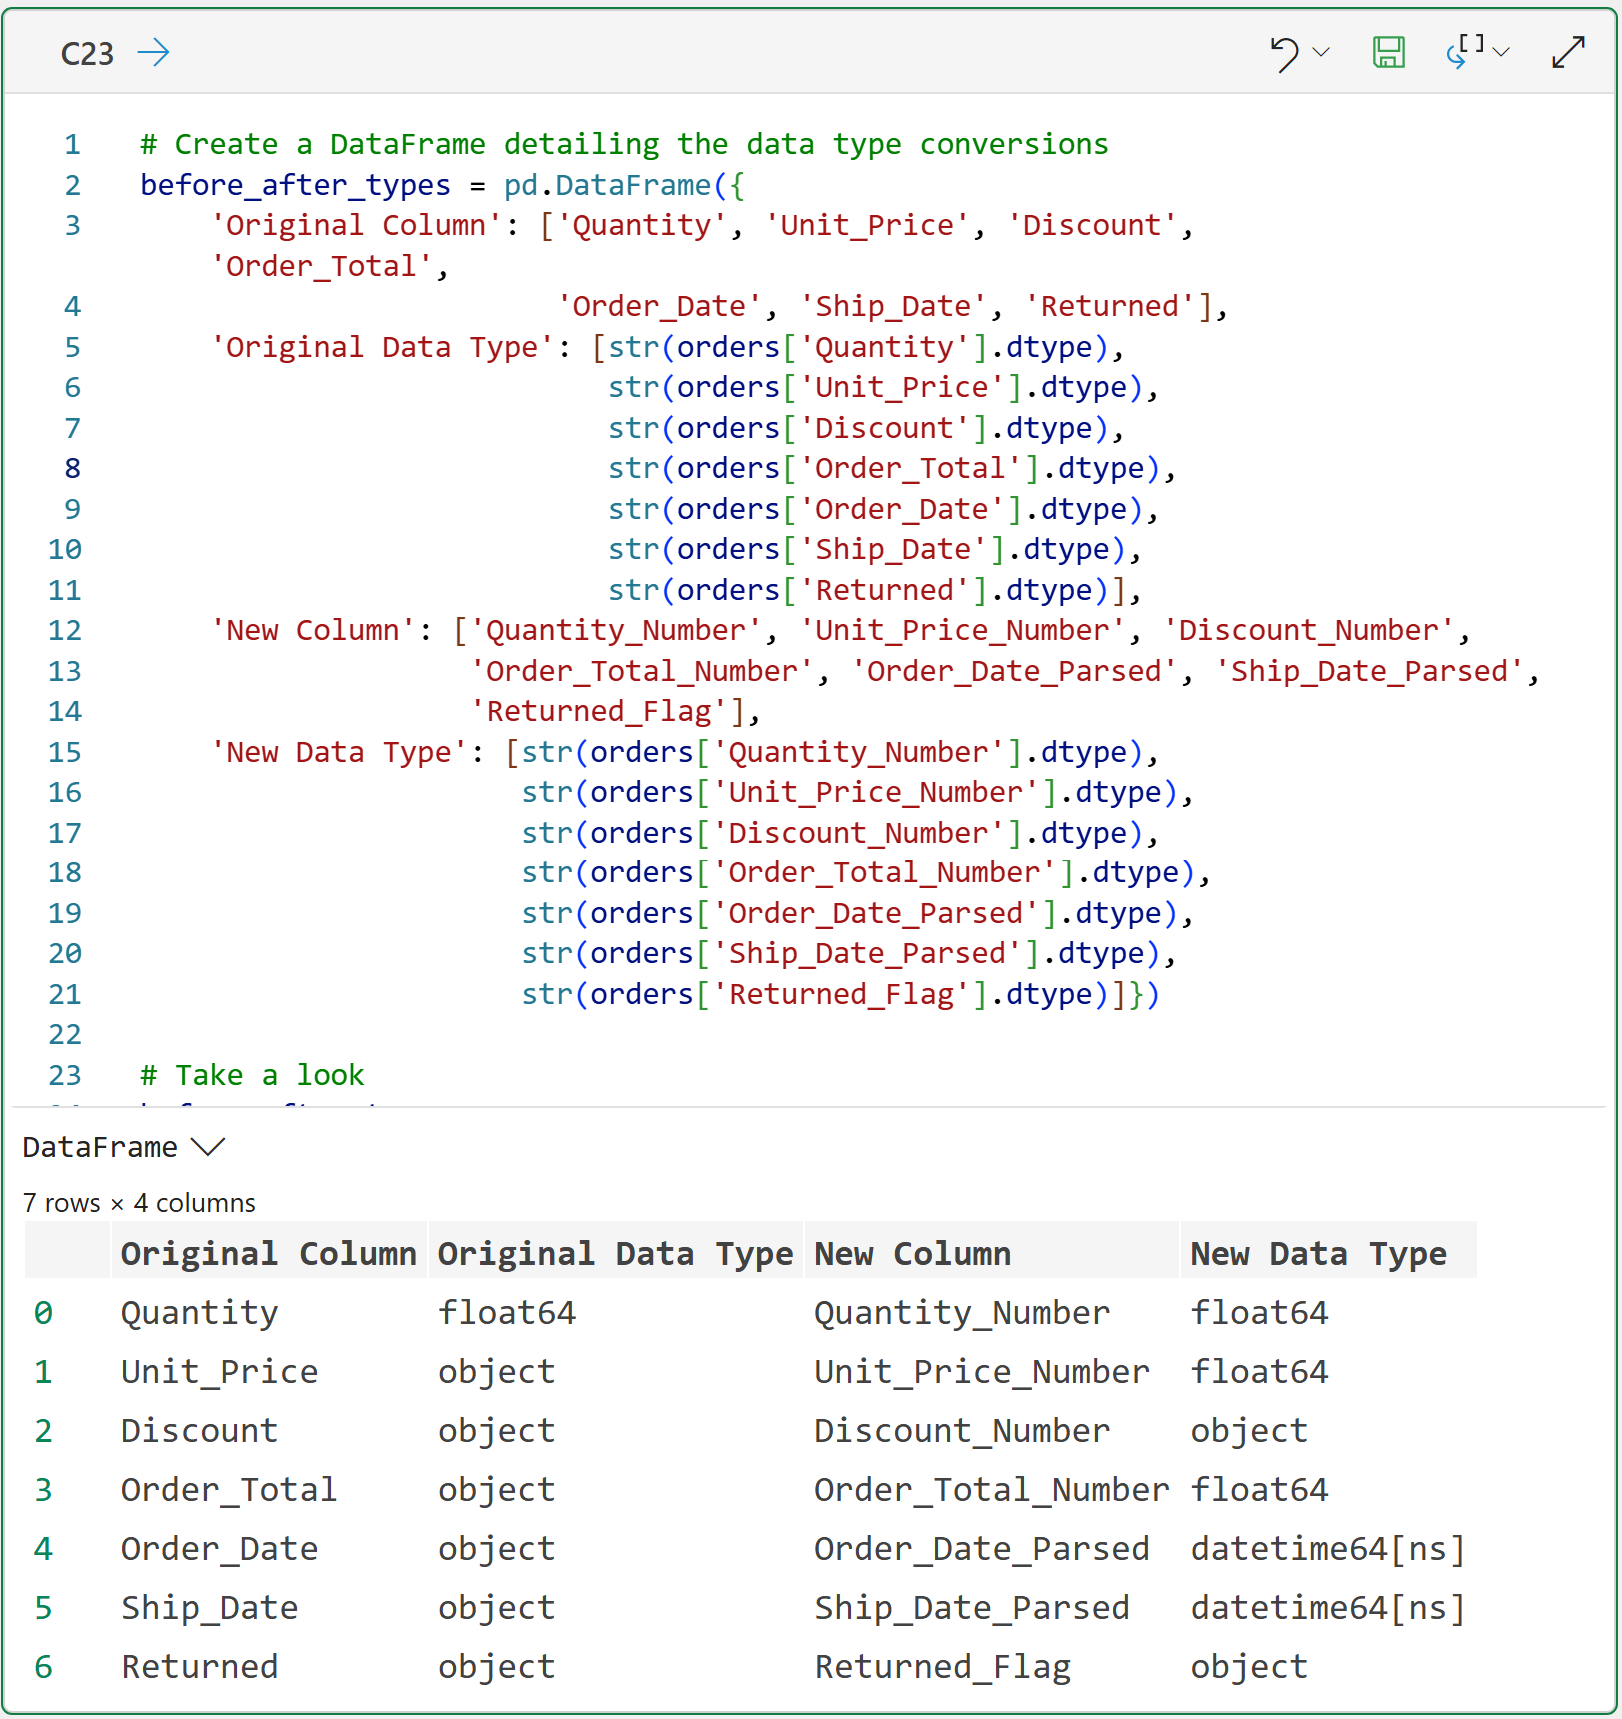
This DataFrame is useful because it connects each messy original field to its cleaner typed version.
For learning purposes, I recommend creating new converted columns. This makes the changes easier to inspect and share with business subject matter experts.
Later in the series, once you are comfortable with our cleaning logic, you can create a cleaner final dataset with better column names and final field choices.
What You Fixed
In this tutorial, you created cleaner versions of several fields:
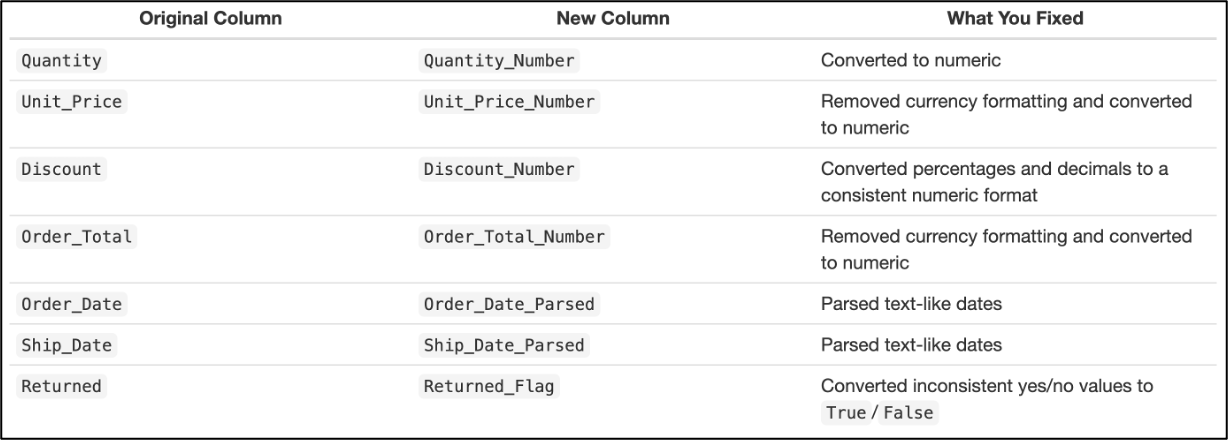
You also cleaned the column names enough to make the code easier to read.
What You Didn’t Fix Yet
This is just as important.
You did not fully clean the dataset. You didn't decide:
Which missing values should be filled
Which rows should be dropped
Whether negative quantities are valid
Whether unusually large unit prices are outliers
How to standardize region labels
How to standardize sales channel labels
How to clean customer names and email addresses
How to handle duplicate rows or repeated order IDs
Whether ship dates before order dates should be corrected, flagged, or removed
Those are separate cleaning decisions.
Trying to do everything at once is one of the easiest ways to confuse yourself. A better approach is to clean data in layers. This tutorial focused on one layer:
Get the important fields for your data analysis into the right data types.
Practice Exercise
Before moving to Part 3, try answering these questions:
Which original numeric-looking column had the most failed conversions?
Which date column had more failed conversions?
How many missing values exist in Discount_Number?
How many rows have a missing Returned_Flag?
Why should Customer_ID usually be stored as text instead of a number?
What is one cleaning decision you intentionally postponed?
Key Takeaway
Fixing data types is one of the most important early steps in data cleaning. It helps turn imported values into fields that can actually be analyzed.
But data type conversion is not the same thing as complete data cleaning:
A converted value may still be wrong.
A parsed date may still violate a business rule.
A missing converted value may still need a decision.
That's why you clean data in stages:
In Part 1, you profiled the dirty data.
In Part 2, you fixed important data type problems.
In Part 3, you will focus on one of the most common and most important data cleaning decisions: What to do with missing data.
That's it for this week.
In the next tutorial, you will start fixing one of the most important data problems: missing data.
Stay healthy and happy data sleuthing!

Dave Langer
Whenever you're ready, here are 3 ways I can help you:
1 - The future of Microsoft Excel is unleashing the power of do-it-yourself (DIY) analytics using Python in Excel. Do you want to be part of the future? My Python in Excel Accelerator online course will teach you what you need to know, and the Virtual Dave AI tutor is included!
2 - Are you new to data analysis? My Visual Analysis with Python online course will teach you the fundamentals you need - fast. No complex math required, and the Virtual Dave AI Tutor is included!
3 - Cluster Analysis with Python: Most of the world's data is unlabeled and can't be used for predictive models. This is where my self-paced online course teaches you how to extract insights from your unlabeled data. The Virtual Dave AI Tutor is included!