

Join 1,000s of professionals who are building real-world skills for better forecasts with Microsoft Excel.
Issue #67 - Data Cleaning Fundamentals Part 1:
Profiling Dirty Data
This Week’s Tutorial
Data cleaning is one of those topics that sounds simple until you try to do it on a real dataset. The problem is usually not one giant, obvious issue. It's usually a collection of smaller problems:
Extra spaces
Missing values
Duplicate records
Inconsistent categories
Numbers stored as text
Dates stored in different formats
Strange values that technically exist, but do not make business sense
That is why the first step in data cleaning is profiling. Profiling means inspecting the dataset before you start fixing it. In other words:
Before you clean the data, you need to understand what's dirty about it.
In this tutorial, you will use Python in Excel to profile a dataset of dirty customer orders. You're not going to fix everything yet. That starts in the next tutorial.
For now, your job is to build a first-pass data quality report.
BTW - Even though I'm using Python in Excel for this tutorial series, the Python code is 99+% the same whether you're using Excel, Jupyter Notebook, or VS Code.
The Series
This tutorial is Part 1 of the Data Cleaning Fundamentals series:
Data Cleaning Fundamentals Part 1: Profiling Messy Data
Data Cleaning Fundamentals Part 2: Fixing Data Types
Data Cleaning Fundamentals Part 3: Handling Missing Data
Data Cleaning Fundamentals Part 4: Cleaning Numeric Data
Data Cleaning Fundamentals Part 5: Cleaning Categories
Data Cleaning Fundamentals Part 6: Cleaning Text Data
Data Cleaning Fundamentals Part 7: Cleaning Dates and Times
Data Cleaning Fundamentals Part 8: Building Repeatable Workflows
Data Cleaning Fundamentals Part 9: Cleaning a Messy Dataset from Start to Finish
The goal of the series is not to cover every possible data cleaning issue. The goal is to attain the proverbial 80/20 Rule - the subset of techniques you use most of the time in real-world analytics.
What You’ll Learn
In this tutorial, you will learn how to use Python in Excel to answer basic profiling questions:
Are there duplicate rows?
What are the column names?
Are there duplicate business keys?
Which columns have missing values?
How many rows and columns are in the dataset?
Which columns might have the wrong data type?
Do categorical columns contain inconsistent labels?
Do date columns contain values that may not really be dates?
Do numeric columns contain values that may not really be numbers?
These questions may sound basic. Answering these questions is how you prevent bad data analyses.
The Dataset
As you might imagine, getting a company to publicly release a dirty dataset for use in a tutorial is very unlikely for various reasons (e.g., legal considerations).
So, you will be using a synthetic customer orders dataset for this tutorial series, designed to illustrate the common dirtiness found in business data.
The dataset is available for you to download as an Excel workbook named DataCleaningFundamentals.xlsx from the newsletter's GitHub repository.
It's highly recommended that you download the dataset and follow along by writing your own code. The code that you write in this tutorial series can be reused in your own real-world projects.
The data is stored in the CustomerOrders table in the workbook and contains 10,000 rows. It also includes the following columns (i.e., features):
Order ID
Customer ID
Customer Name
Email Address
Order Date
Ship Date
Region
Sales Channel
Product Category
Quantity
Unit Price
Discount
Order Total
Returned Flag
Sales Rep
Customer Segment
Each part of the tutorial series will teach you different data-cleaning concepts and skills you can apply to your analytics projects at work.
The workbook also includes a MarketingLeads table. You will use this dataset to apply what you learn in Part 9 as a capstone project.
Step 1: Load the Excel Table Into Python
First, load the Excel table into a pandas DataFrame:
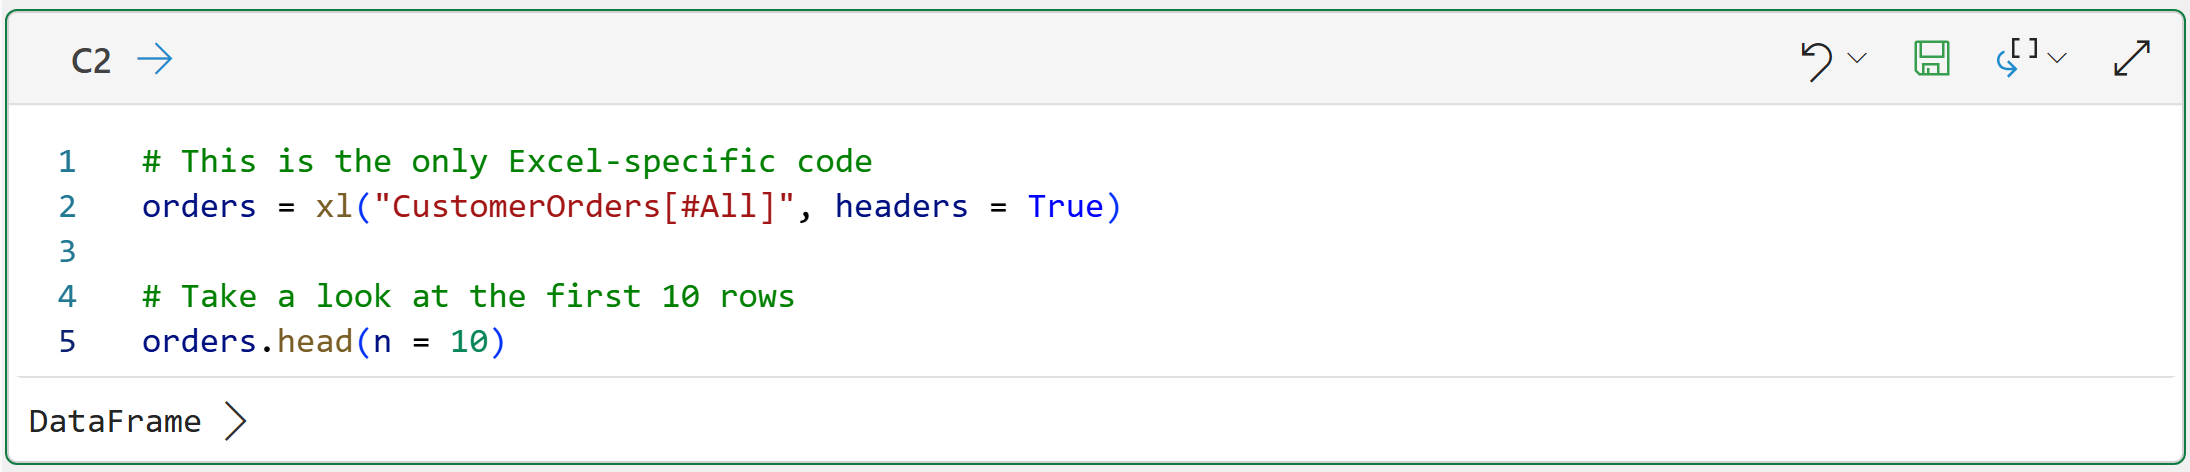
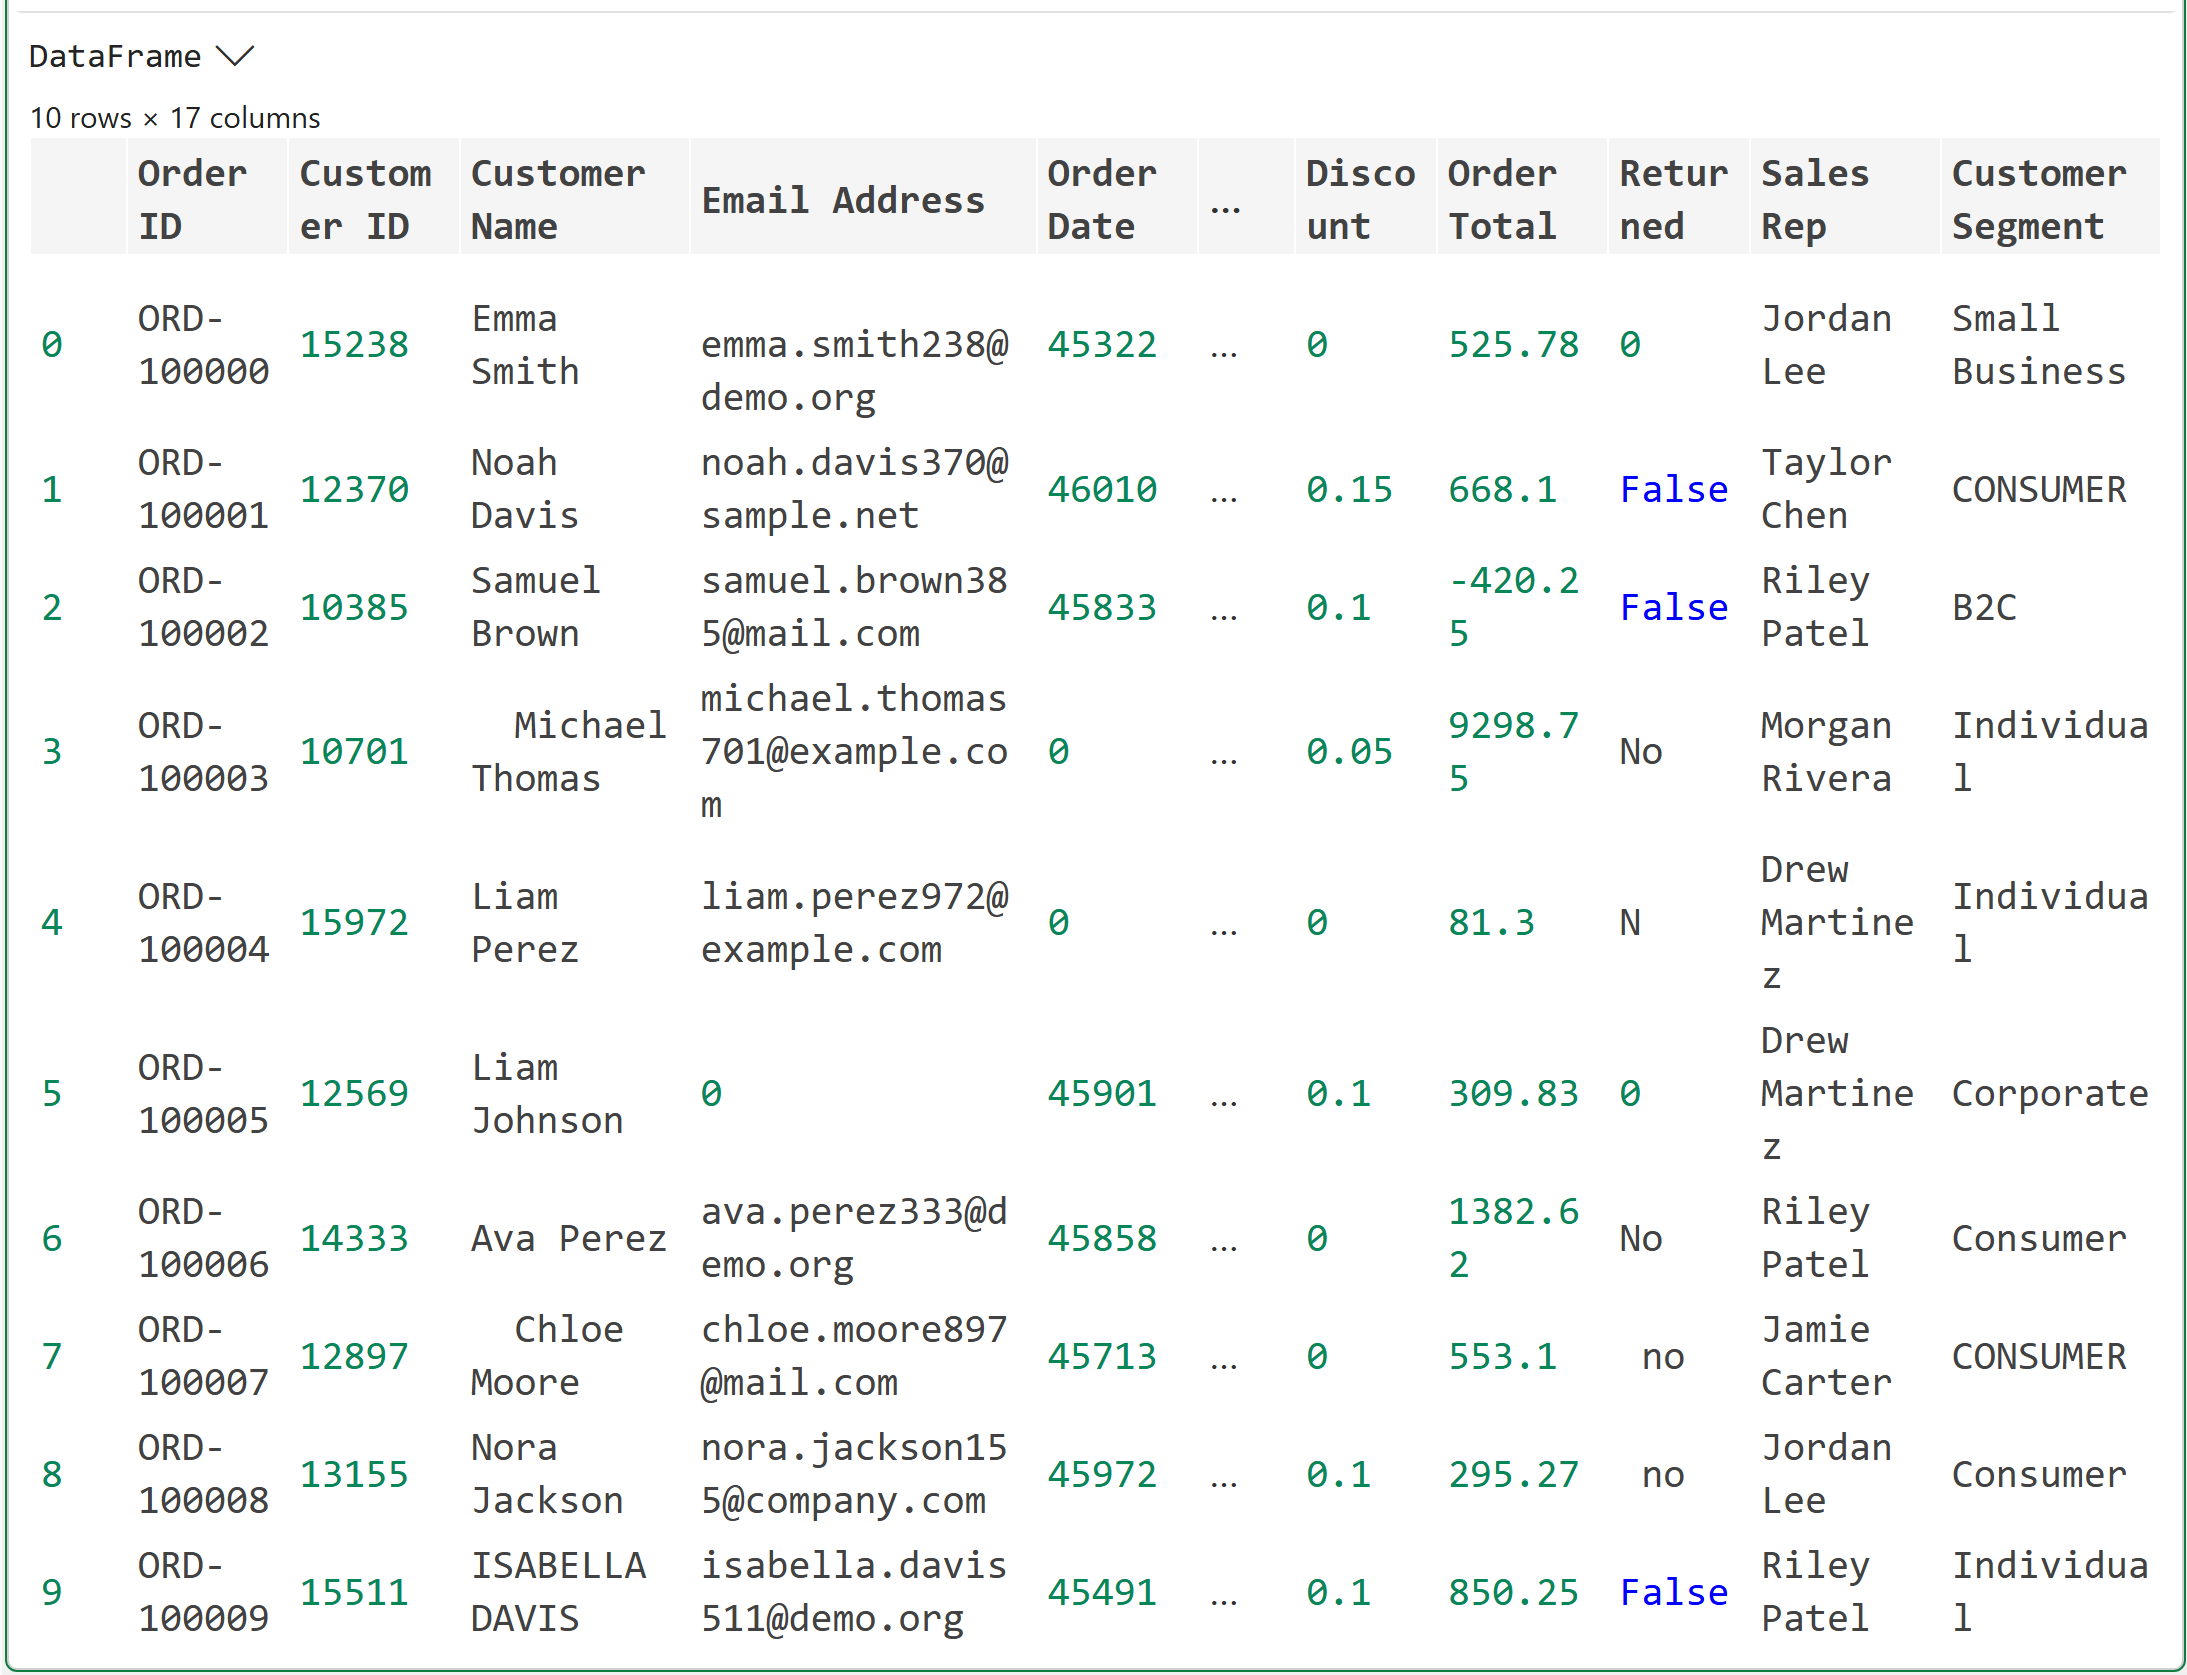
Looking at the first 10 rows gives you a quick introduction to what's going on in the dataset:
BTW - If you're new to Python, check out the 5-star reviews for my book Python in Excel Step-by-Step on Amazon.
At this point, you aren't trying to find every problem in the data. You are simply asking:
Does the dataset look like what I was expecting?
For example, do the features make sense given the nature of the data set?
Do the rows look like individual orders?
Are there obvious blanks, weird formats, or inconsistent values?
Step 2: Check the Size of the Dataset
As it turns out, profiling datasets is so common that you can call the info() method on a DataFrame to get a lot of useful summary information about a dataset:
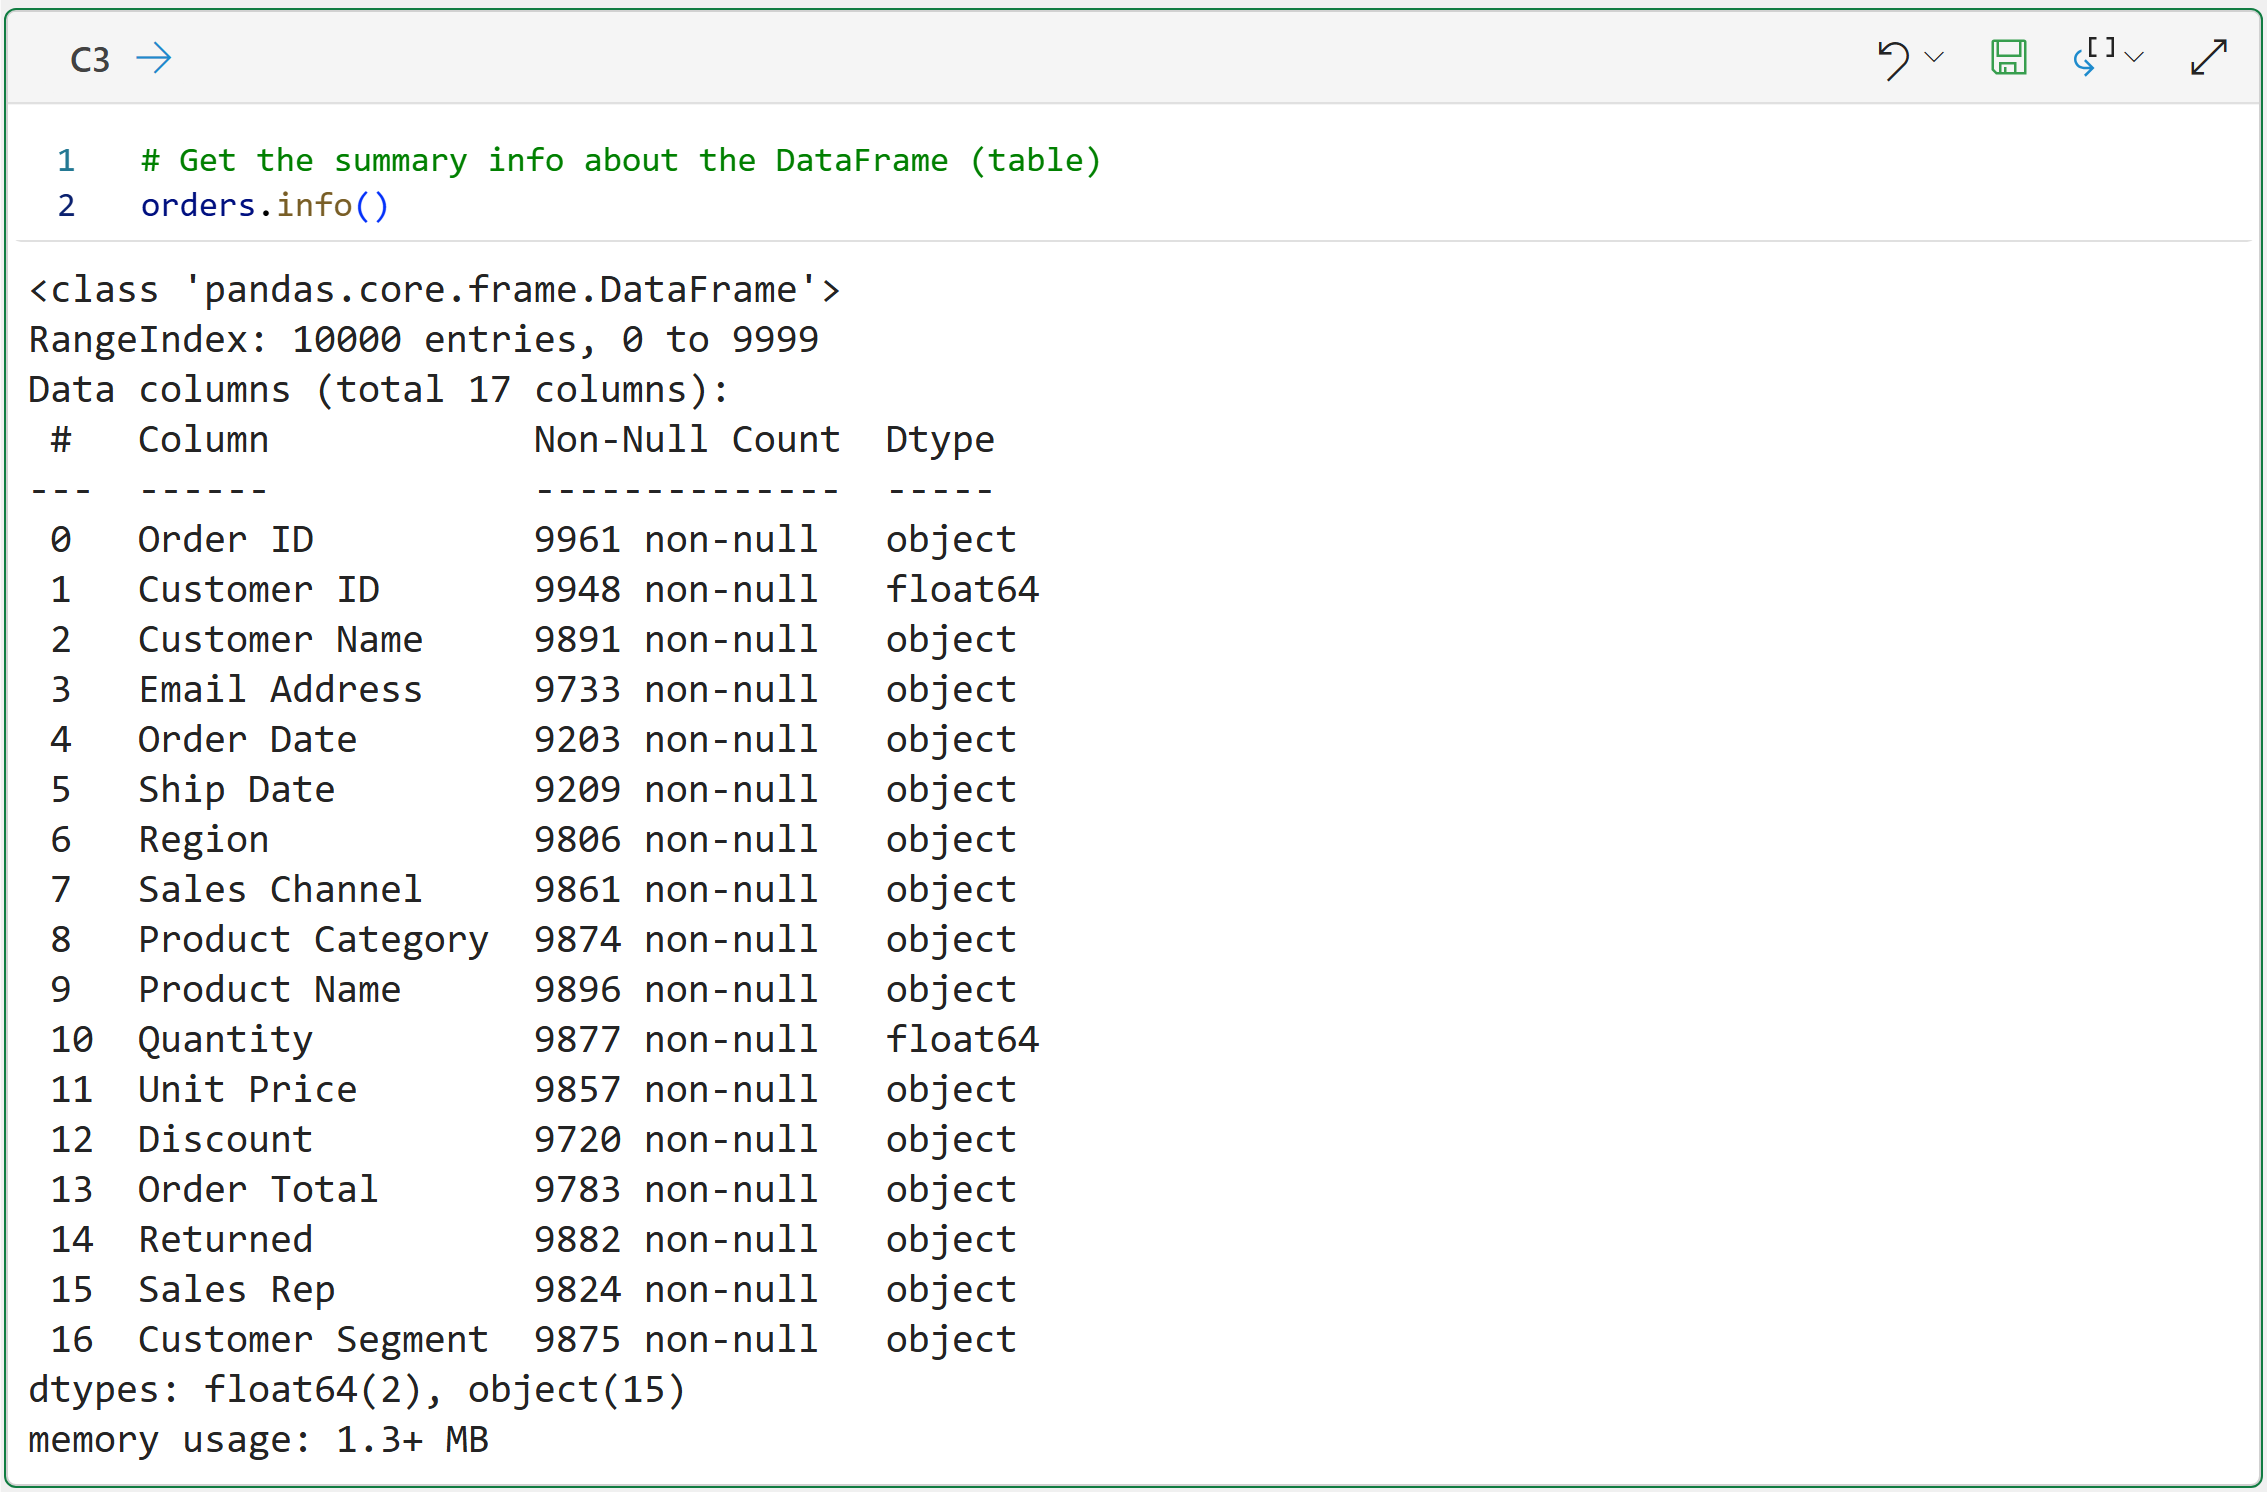
The first thing you want to know is the number of rows and columns. Take a look at the output in cell C3:
The number of rows is 10000 entries.
There are 17 columns in the dataset.
As a reminder, Python starts counting from zero. You'll notice this in two places in cell C3's output:
The rows are numbered 0 to 9999.
The first column (i.e., Order ID) is numbered 0.
Knowing the row and column counts might seem trivial, but it's critical to know before you start cleaning. Why?
Because the row and column counts can change during cleaning. You might remove columns, add columns, or remove duplicate rows.
So, you want to know how the dataset has changed from the starting point to help you recognize if you made a mistake.
A good habit is to check row and column counts before and after important cleaning steps.
Step 3: Create a Basic Profile Column
The next step is to build an initial understanding of the columns (or features). For convenience, I'm going to show just the info() output here:
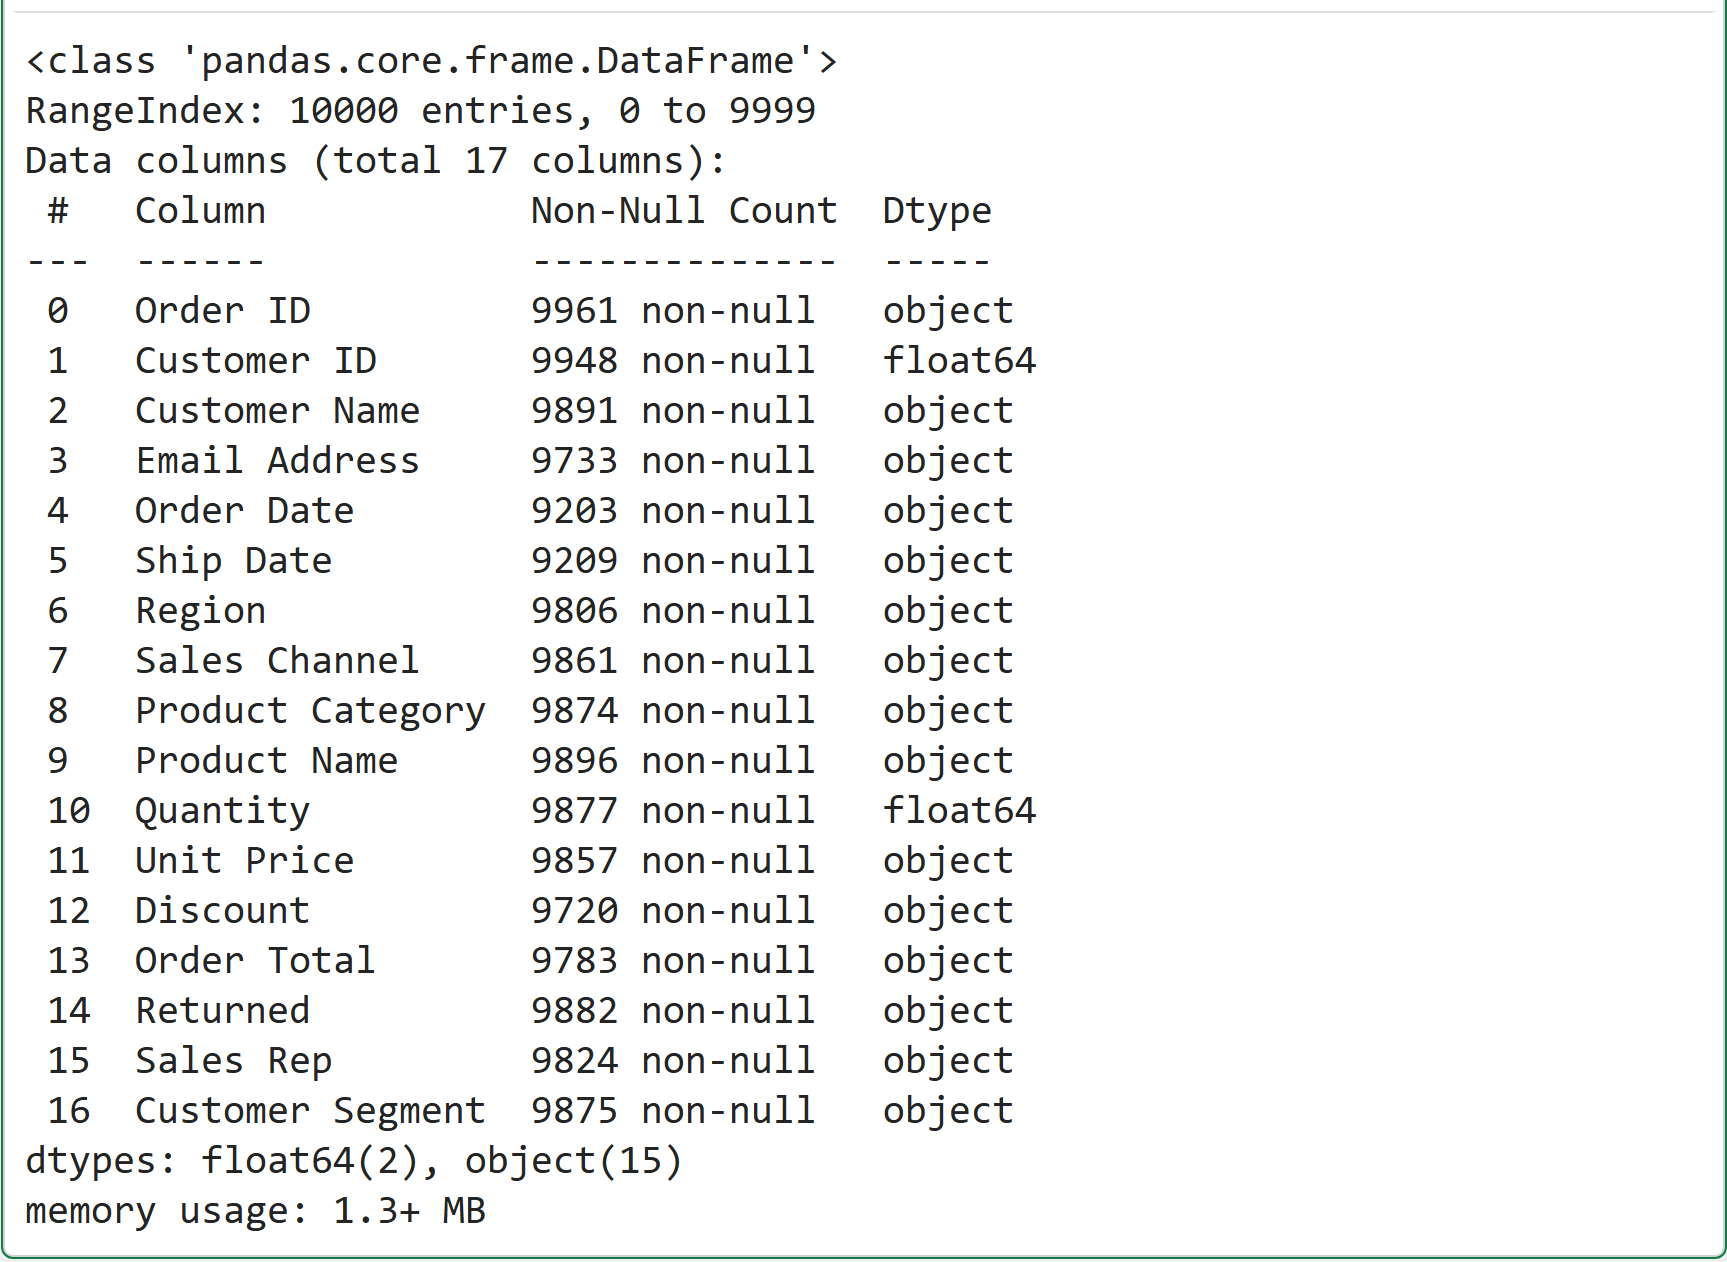
The info() output tells you many useful things about the features in the dataset:
Which features exist?
Which features contain missing values?
How pandas currently understands each feature.
The first bullet is very intuitive - you just look at the list of feature names. Once again, what you're looking for here is straightforward.
Do the features make sense based on the nature of the dataset (e.g., customer orders)? Do you see all the features you would expect? You get the idea.
The second bullet requires a bit of explanation. From Step 1, you know that there are 10,000 rows in the data set. In the info() output, there's a Non-Null Count column that indicates the number of missing values.
If you're unfamiliar, Null is a common term across many technologies (e.g., databases) denoting a missing value. Hence, Non-Null is the opposite - data that is present.
Given this, when you look down the Non-Null Count column and see a number less than the total number of rows, then you know that column contains missing values.
For example, the Order ID feature has 9,961 non-null values. That means it's missing 39 values. Given that this feature is a unique identifier, that might be a big problem! 🤣
The last bullet deserves special attention. In the info() output, take a look at the Unit Price feature entry - specifically the Dtype (or data type).
You would expect the Unit Price feature to have a numeric data type - most likely a float64 because this feature should contain numeric decimal values.
However, pandas interpreted this feature as an object data type instead. If you're new to pandas, this data type represents a string (i.e., text) value.
So, here's an important warning for your data cleaning efforts:
The data type pandas interprets is not always correct!
For example, a feature may look like a number to a person but be stored as a string because it contains dollar signs, commas, percent signs, blanks, or other non-numeric characters.
You will deal with situations like that in Part 2. For now, you are just identifying the issue.
NOTE - If you're using Python in Excel, this demonstrates why you must ensure your Excel table columns have the correct cell formats before loading the table into Python - it helps minimize your data cleaning work.
Step 4: Check for Dirty Column Names
Column names are data too. If column names contain extra spaces or inconsistent formatting, they make later code more difficult to write and more error-prone.
The following Python code creates a DataFrame containing all the columns, the lengths of the column names, and whether they have leading/trailing spaces in the name:
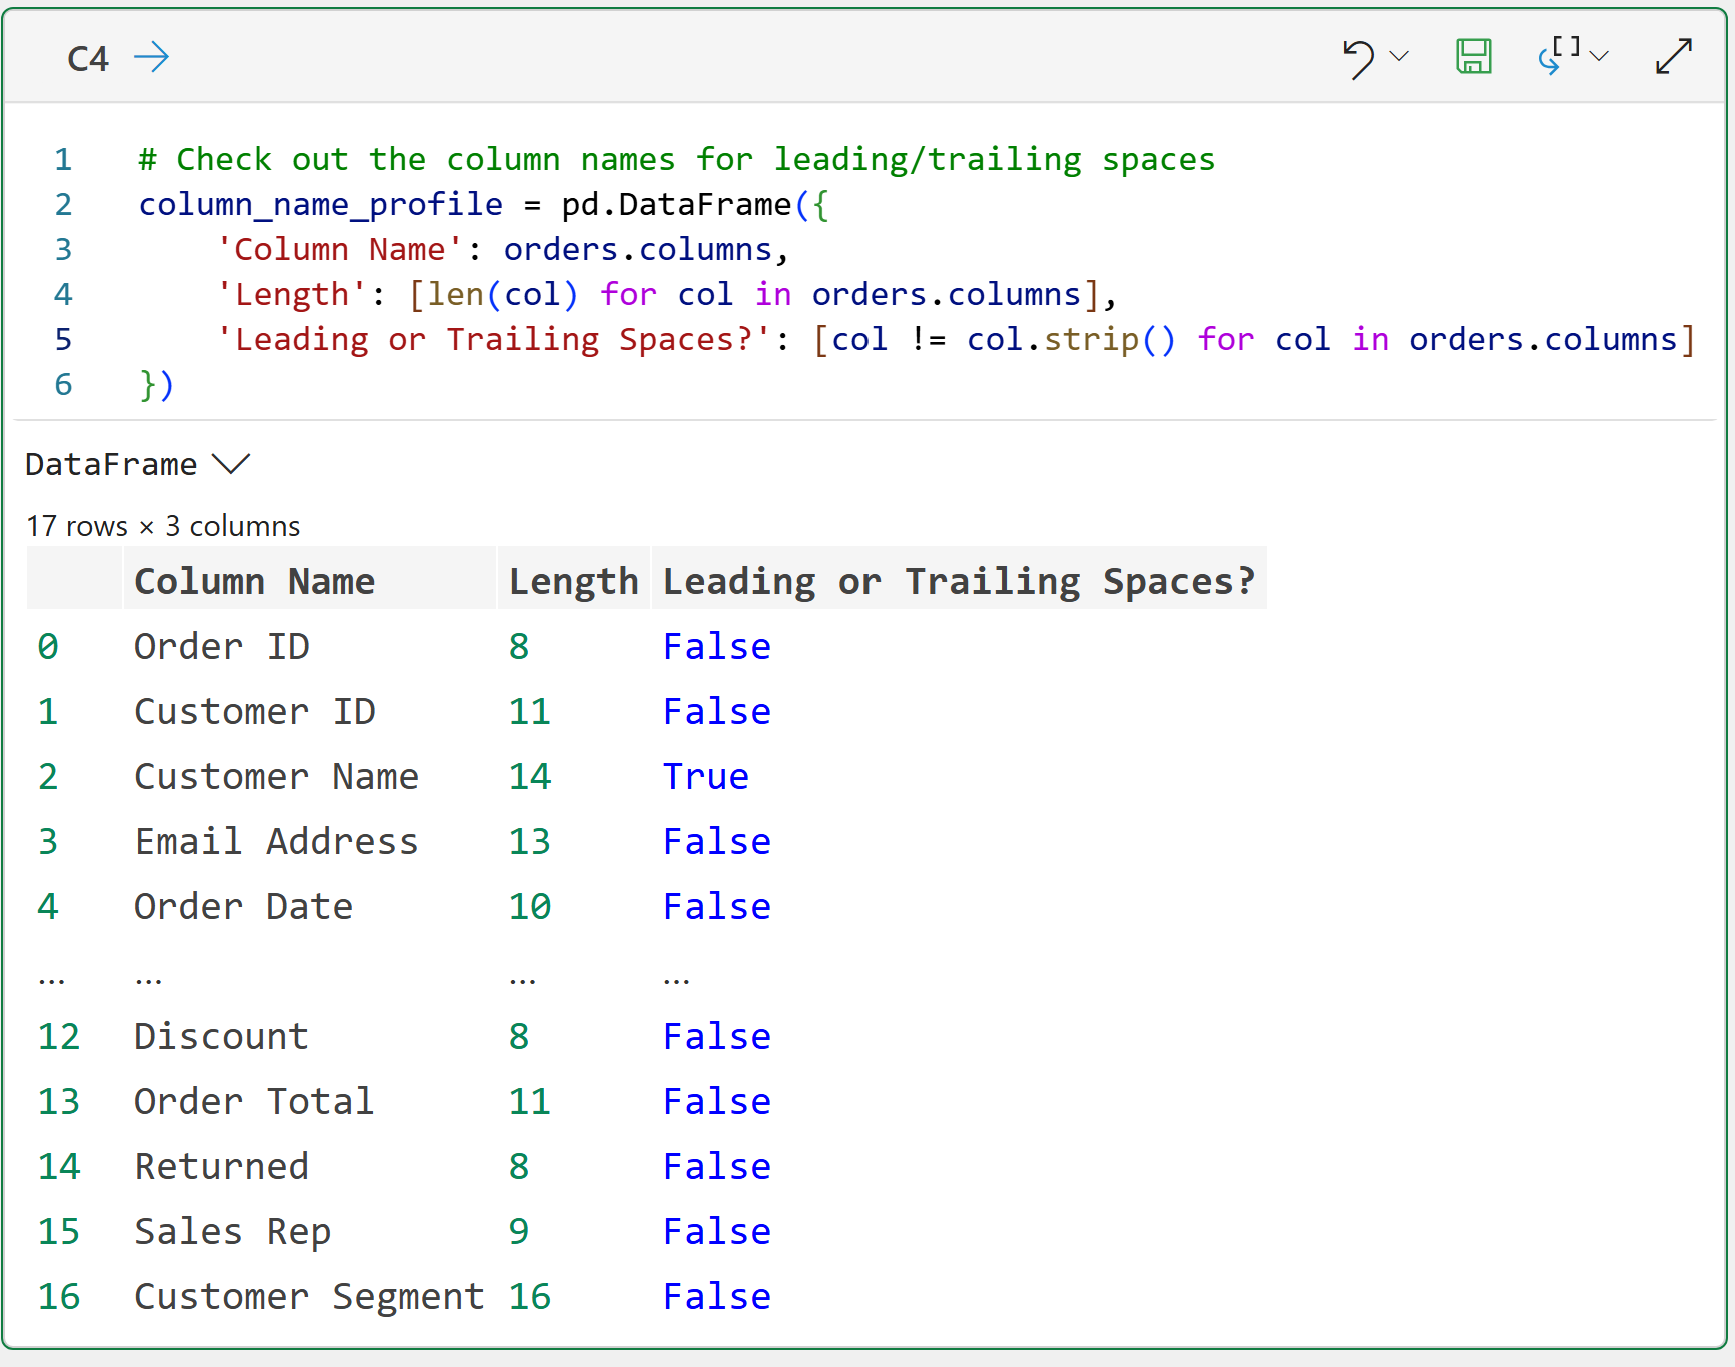
This helps you spot column name problems. In this dataset, at least one column name contains an extra space.
That may seem like a tiny issue, but it matters. For example, these two column names are not the same as far as Python is concerned:
Customer Name
Customer Name
The second one has a trailing space. To the naked eye, they look identical. To Python, they are different.
You will clean column names later. For now, you simply want to detect the problem.
NOTE - It's also better to avoid embedded spaces in column names. They can cause issues in a number of analytics scenarios when using Python. For example, it's best to remove embedded spaces from Excel table column names before loading into Python.
Step 5: Profile Missing Values
You know which columns have missing values from Step 3.
However, profiling missing values is about more than just knowing which columns have missing data. It's also about understanding what it means when data is missing from a business process perspective.
Using the CustomerOrders dataset as an example:
A missing Customer ID is likely a serious problem.
A missing Order Total may mean the value failed to import.
A missing Ship Date may mean the order has not shipped yet.
A missing Sales Rep may mean the order was not assigned to a rep.
The correct cleaning decision depends on the feature's meaning.
That's why profiling comes before cleaning, and why you need business knowledge to clean data correctly.
Step 6: Check for Duplicate Rows
Duplicate rows can inflate totals, counts, and conversion rates.
The following code goes through each row in the dataset and checks to see if it's a duplicate (i.e., the duplicated() method returns True in this case, False otherwise):
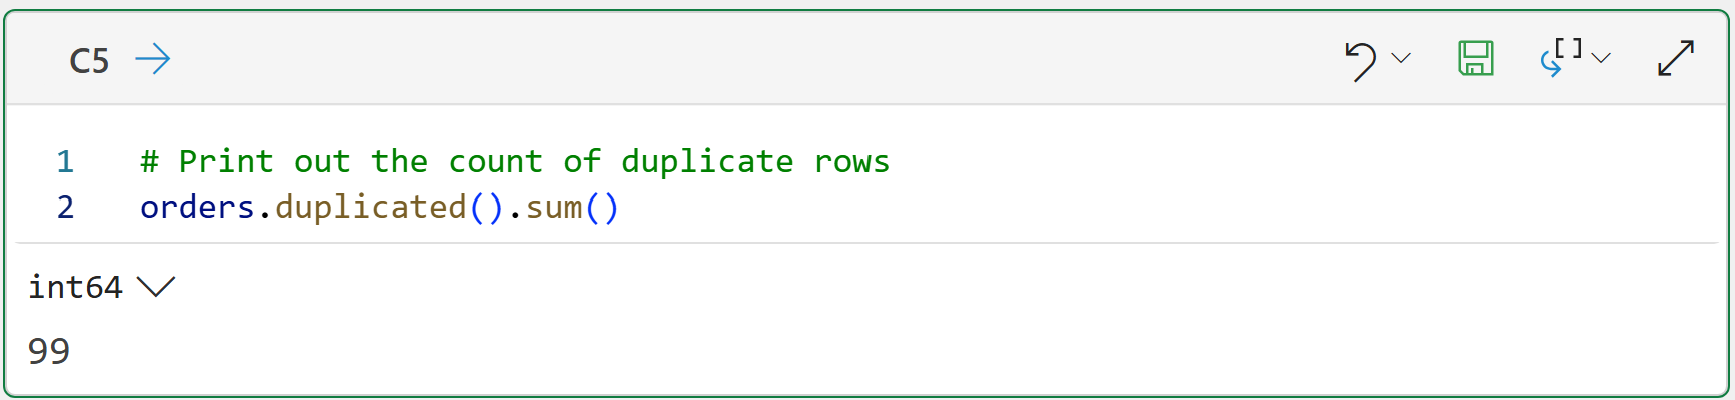
The code above shows that 99 out of the 10,000 rows are duplicates in some form. In real business data, exact duplicates often occur due to export issues, copy-and-paste errors, or repeated file loads.
The following code displays the first 10 duplicated rows:

Clicking on the card for the DataFrame:
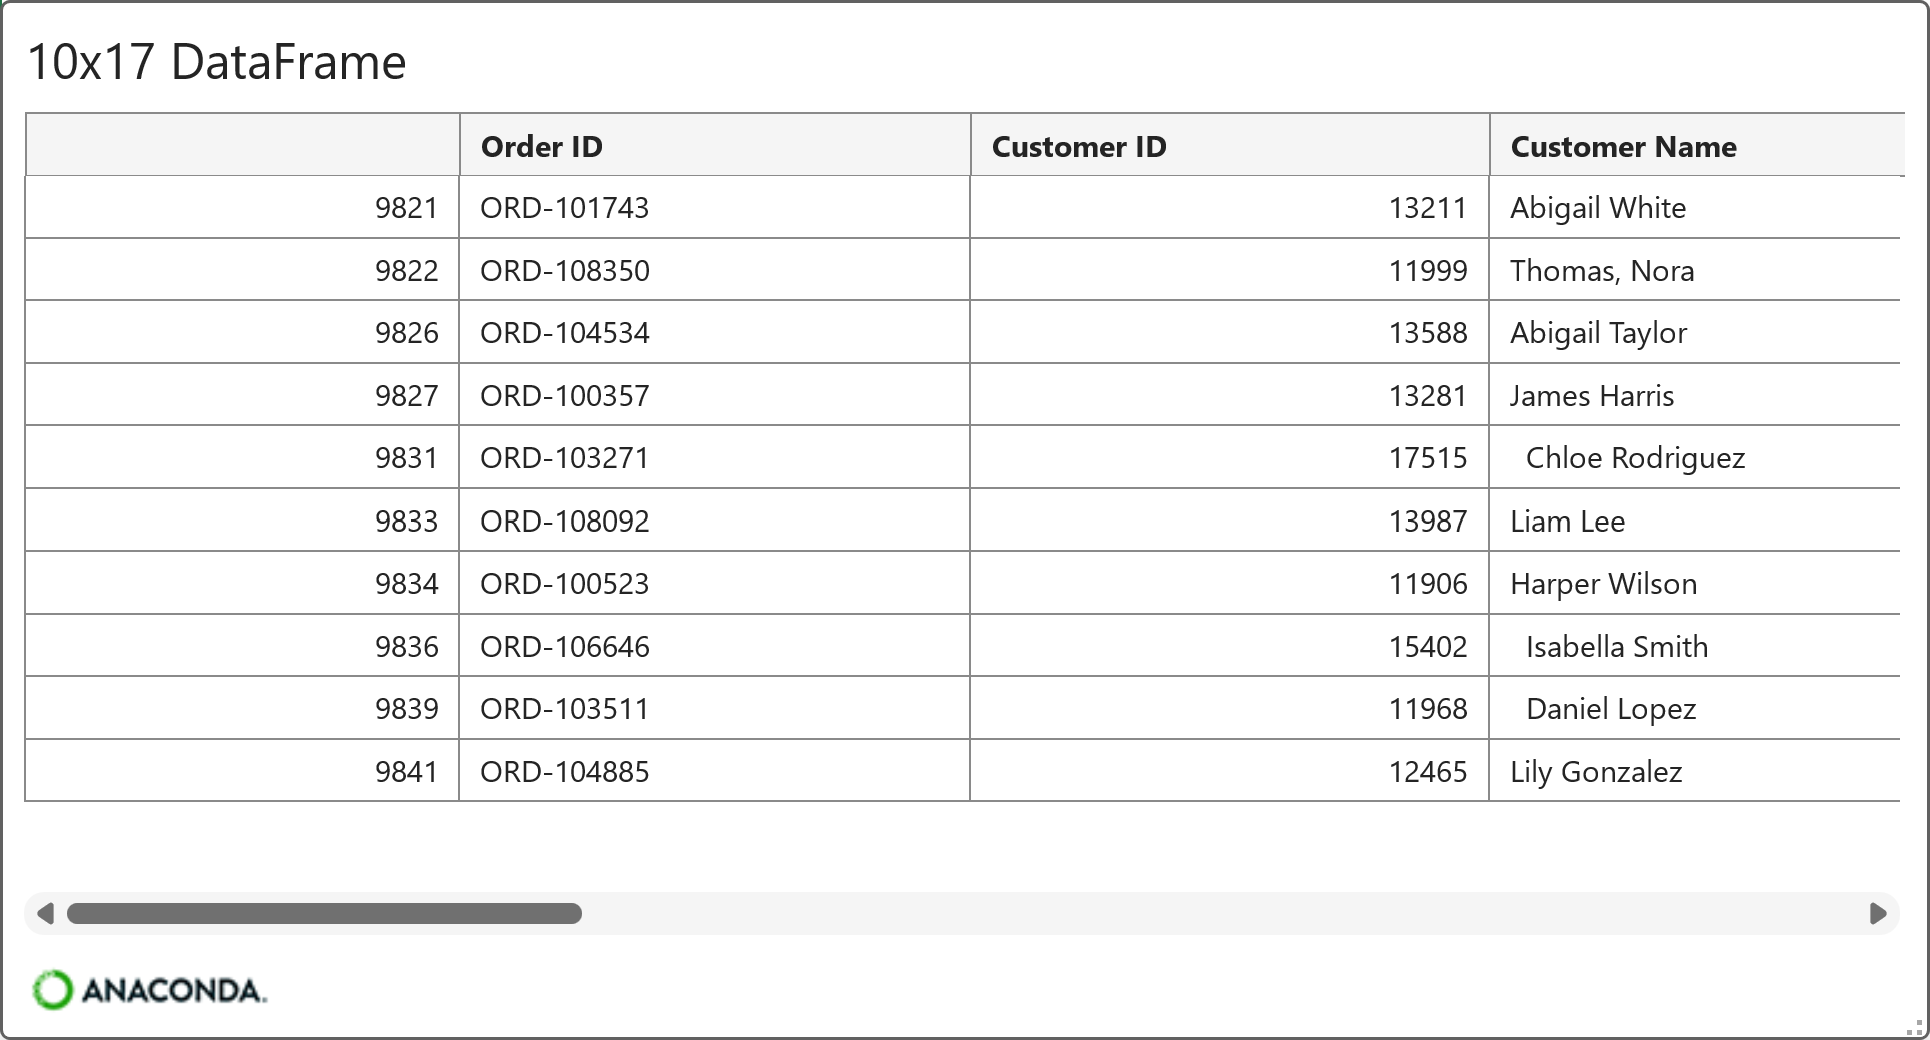
While the above doesn't show any duplicates in the first 10 rows, it's always a good idea to check if there are any duplicate ID values in the dataset:
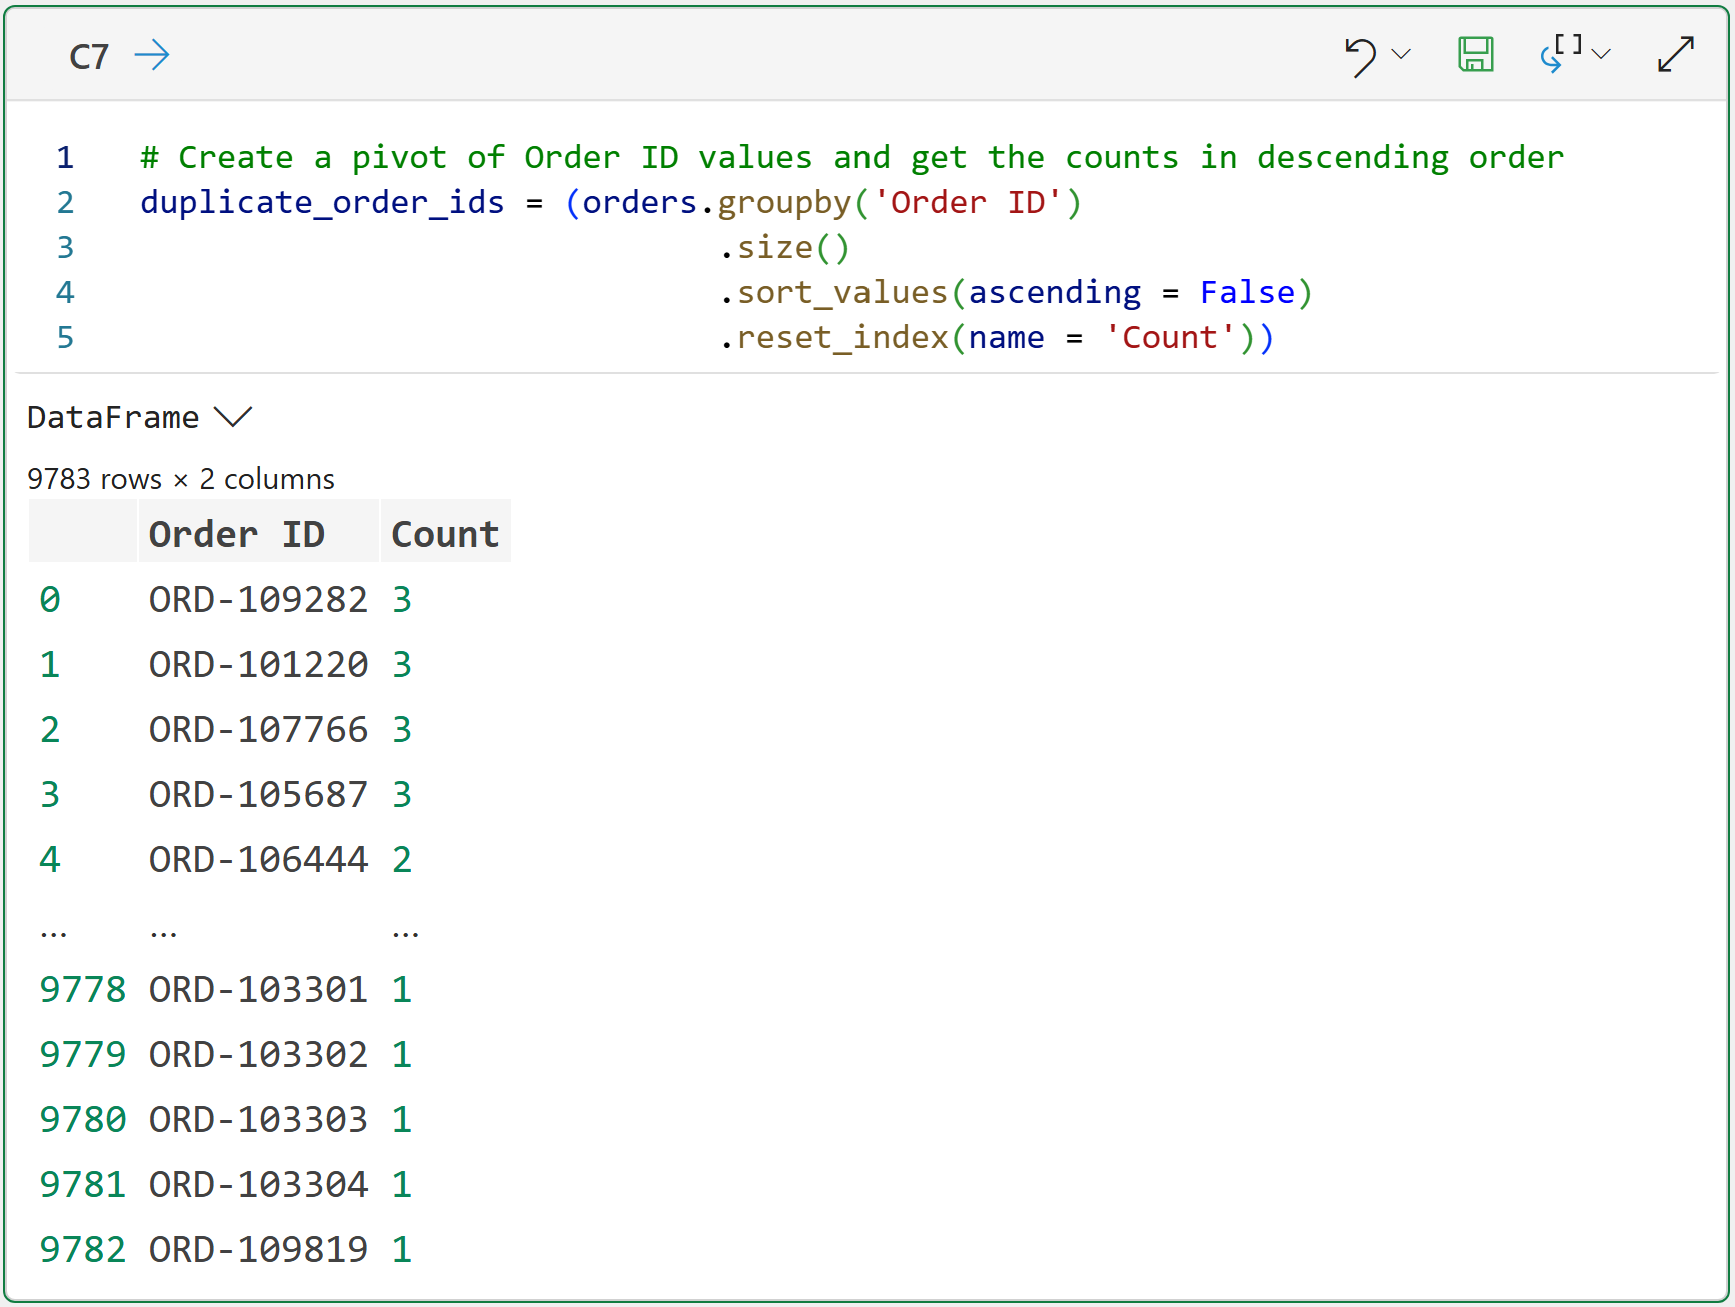
A repeated Order ID may be fine in some datasets. For example, an order-level table may have one row per order ID, while an order-detail table may have one row per product purchased (i.e., the same order ID may appear multiple times).
But this dataset is intended to be an order-level table. That means repeated Order IDs deserve investigation. Notice the wording: deserve investigation.
You are not automatically deleting anything yet.
Step 7: Profile Categorical Columns
Categorical columns contain labels or groups. Examples in this dataset include:
Region
Sales Channel
Product Category
Returned
Customer Segment
A very common data cleaning problem is inconsistent category labels.
For example, these may all mean the same thing:
North
north
NORTH
N.
N
But Python treats them as different values.
The following code inspects the Region column by providing every unique value and how often each unique value occurs in the feature:
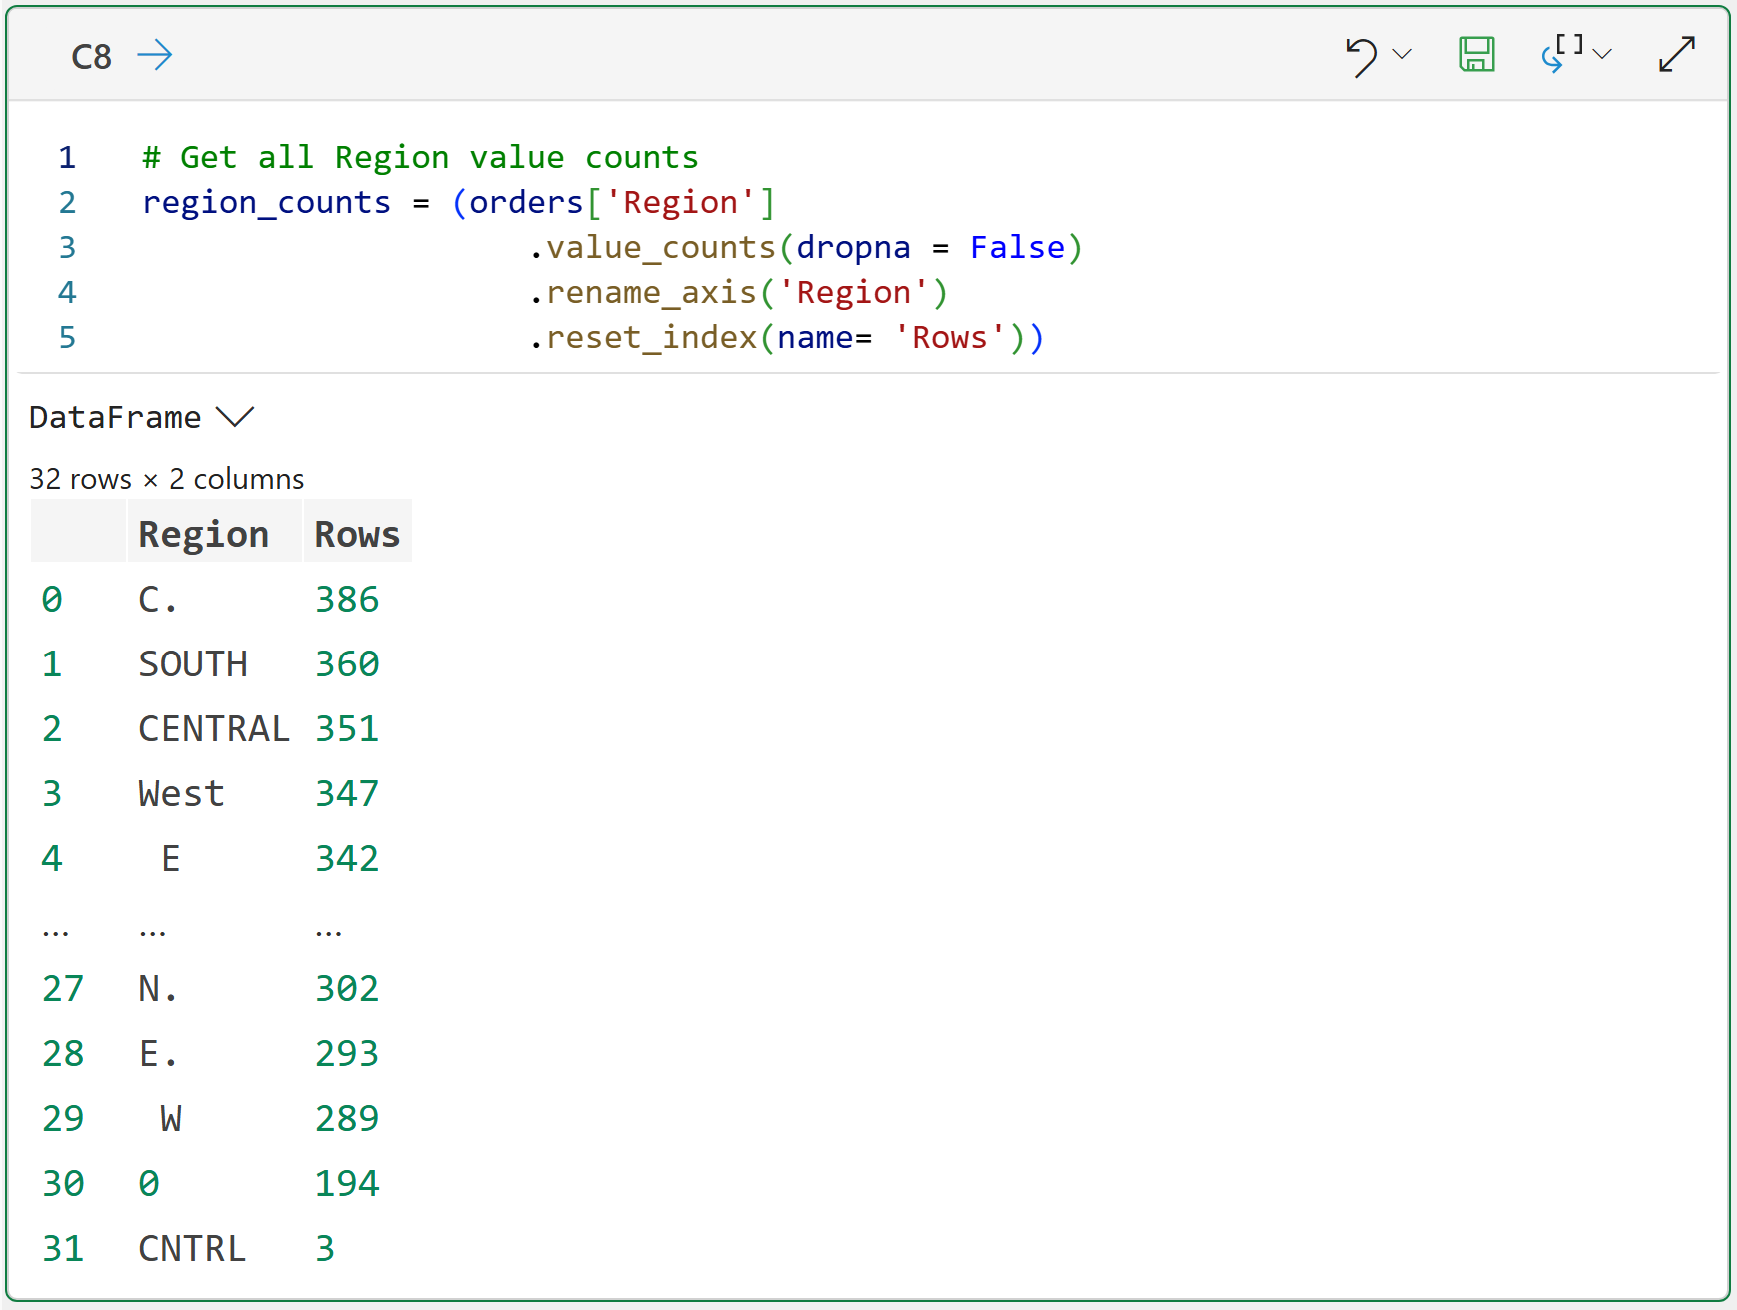
The output above clearly shows inconsistent Region labels. That is a data cleaning issue.
You should repeat this process for every one of your categorical features (e.g., by copying, pasting, and tweaking the code):
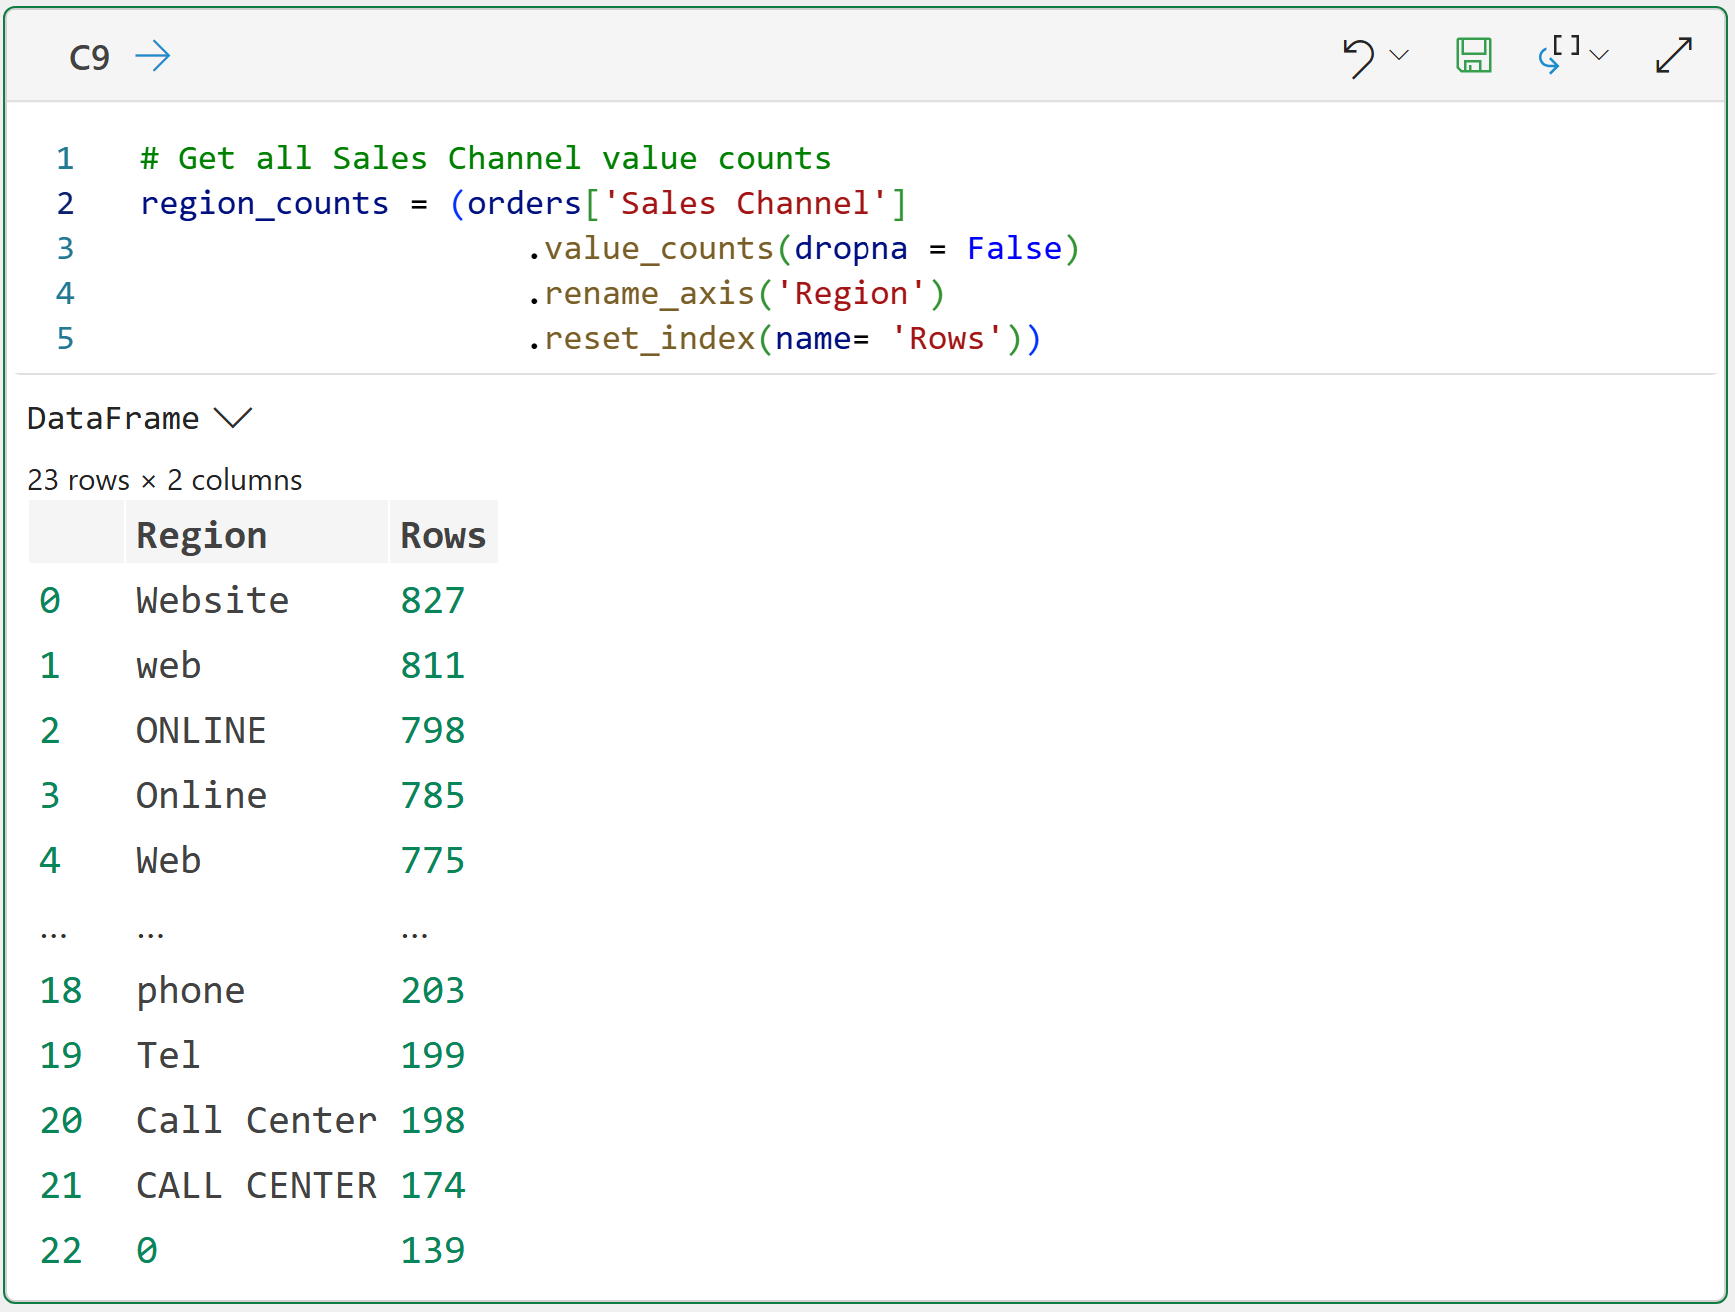
This is one of the best beginner-friendly profiling techniques. When a feature contains categories, start with value_counts(). It quickly reveals:
Abbreviations
Alternate spellings
Inconsistent casing
Unexpected values
Tiny categories that may need grouping
You will clean categorical data later in the series.
As usual, your job right now is to notice the dirtiness.
Step 8: Profile “Numeric-Looking” Columns
Some columns should behave like numbers:
Quantity
Discount
Unit Price
Order Total
But dirty datasets often store numbers as text. Why? Because values may include things like:
Spaces
Commas
Dollar signs
Percent signs
Blanks (i.e., nulls)
Words like unknown
Accidental characters
The following code performs a first-pass profile of a "numeric-looking" column:
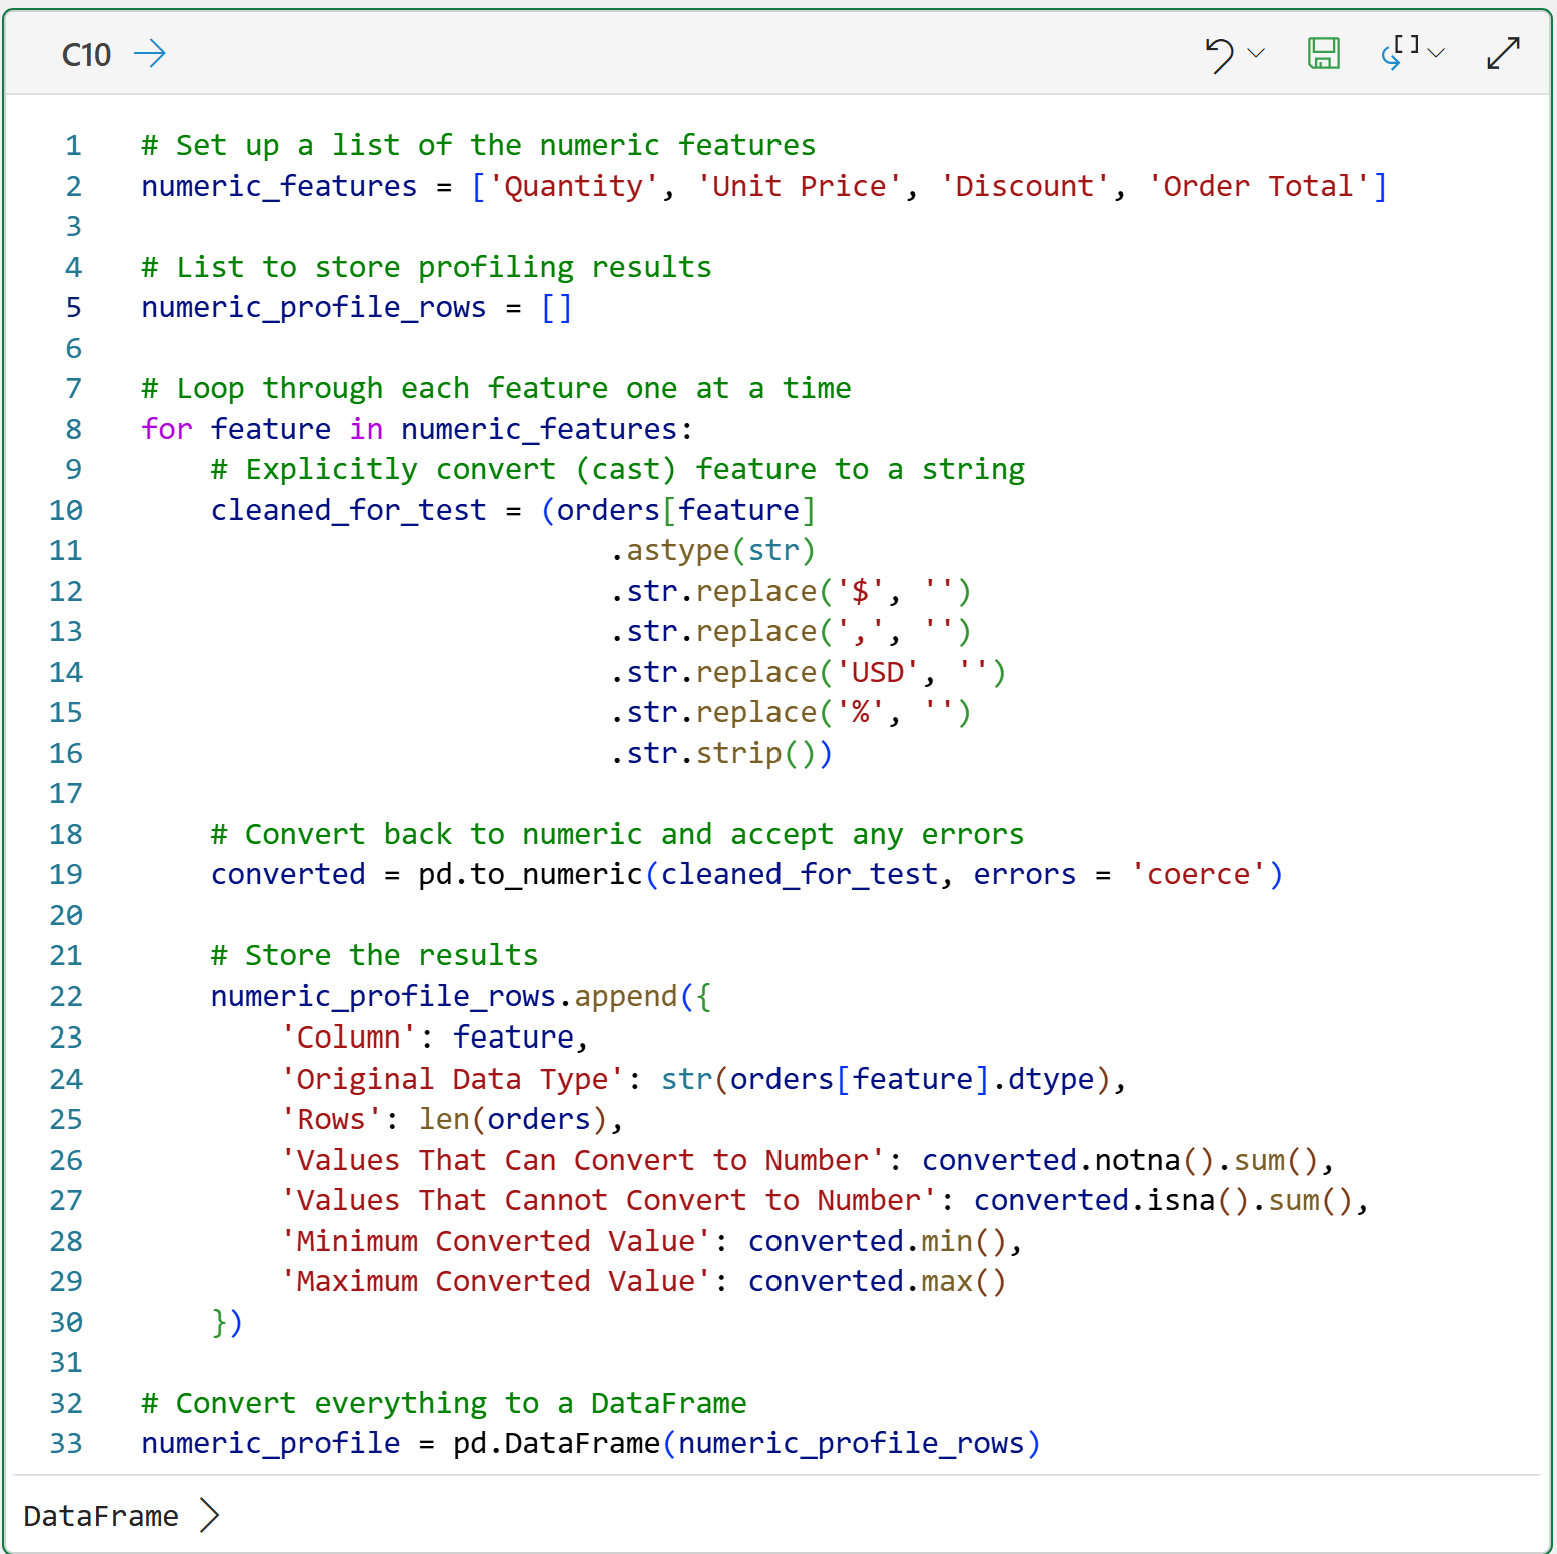
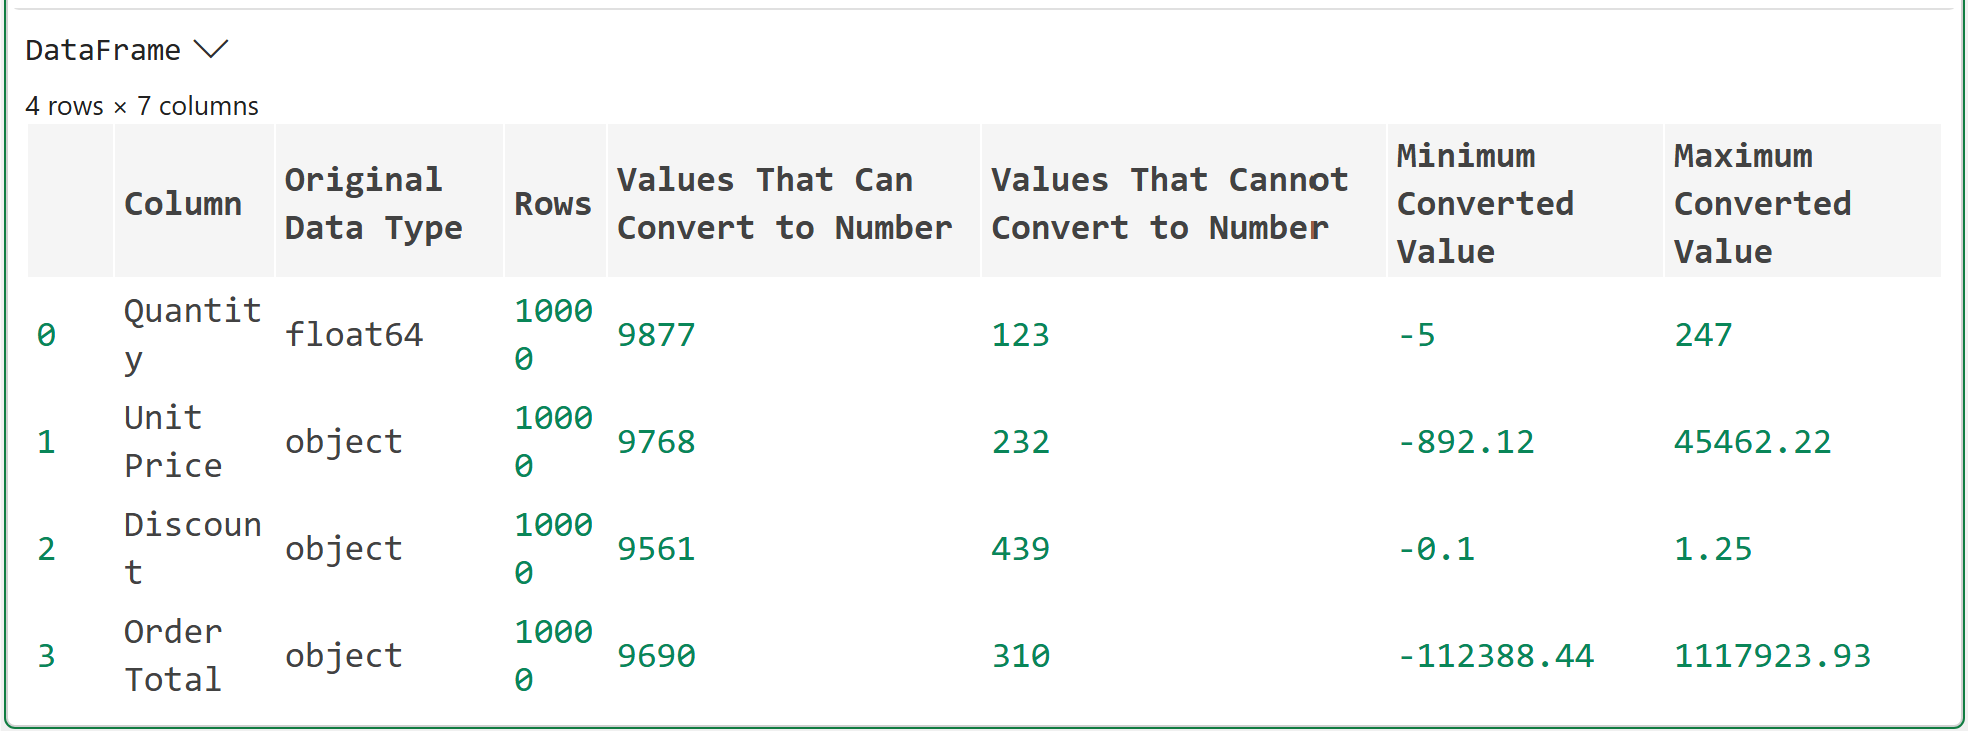
This code does not permanently clean the data. It only tests whether the values can be interpreted as numbers after removing a few common formatting characters.
That distinction matters.
In a real project, you should avoid making silent changes before you understand the consequences. For example:
Should 10% become 10 or 0.10?
Should a negative quantity be allowed?
Should a blank discount become 0 or stay missing?
Should a very large unit price be treated as an outlier or a valid enterprise sale?
Those are cleaning decisions.
Profiling helps us discover where those decisions are needed.
Step 9: Profile “Date-Looking” Columns
Date columns are another common source of problems. This dataset has two date-looking columns:
Order Date
Ship Date
Time to see if there are any issues in these features:
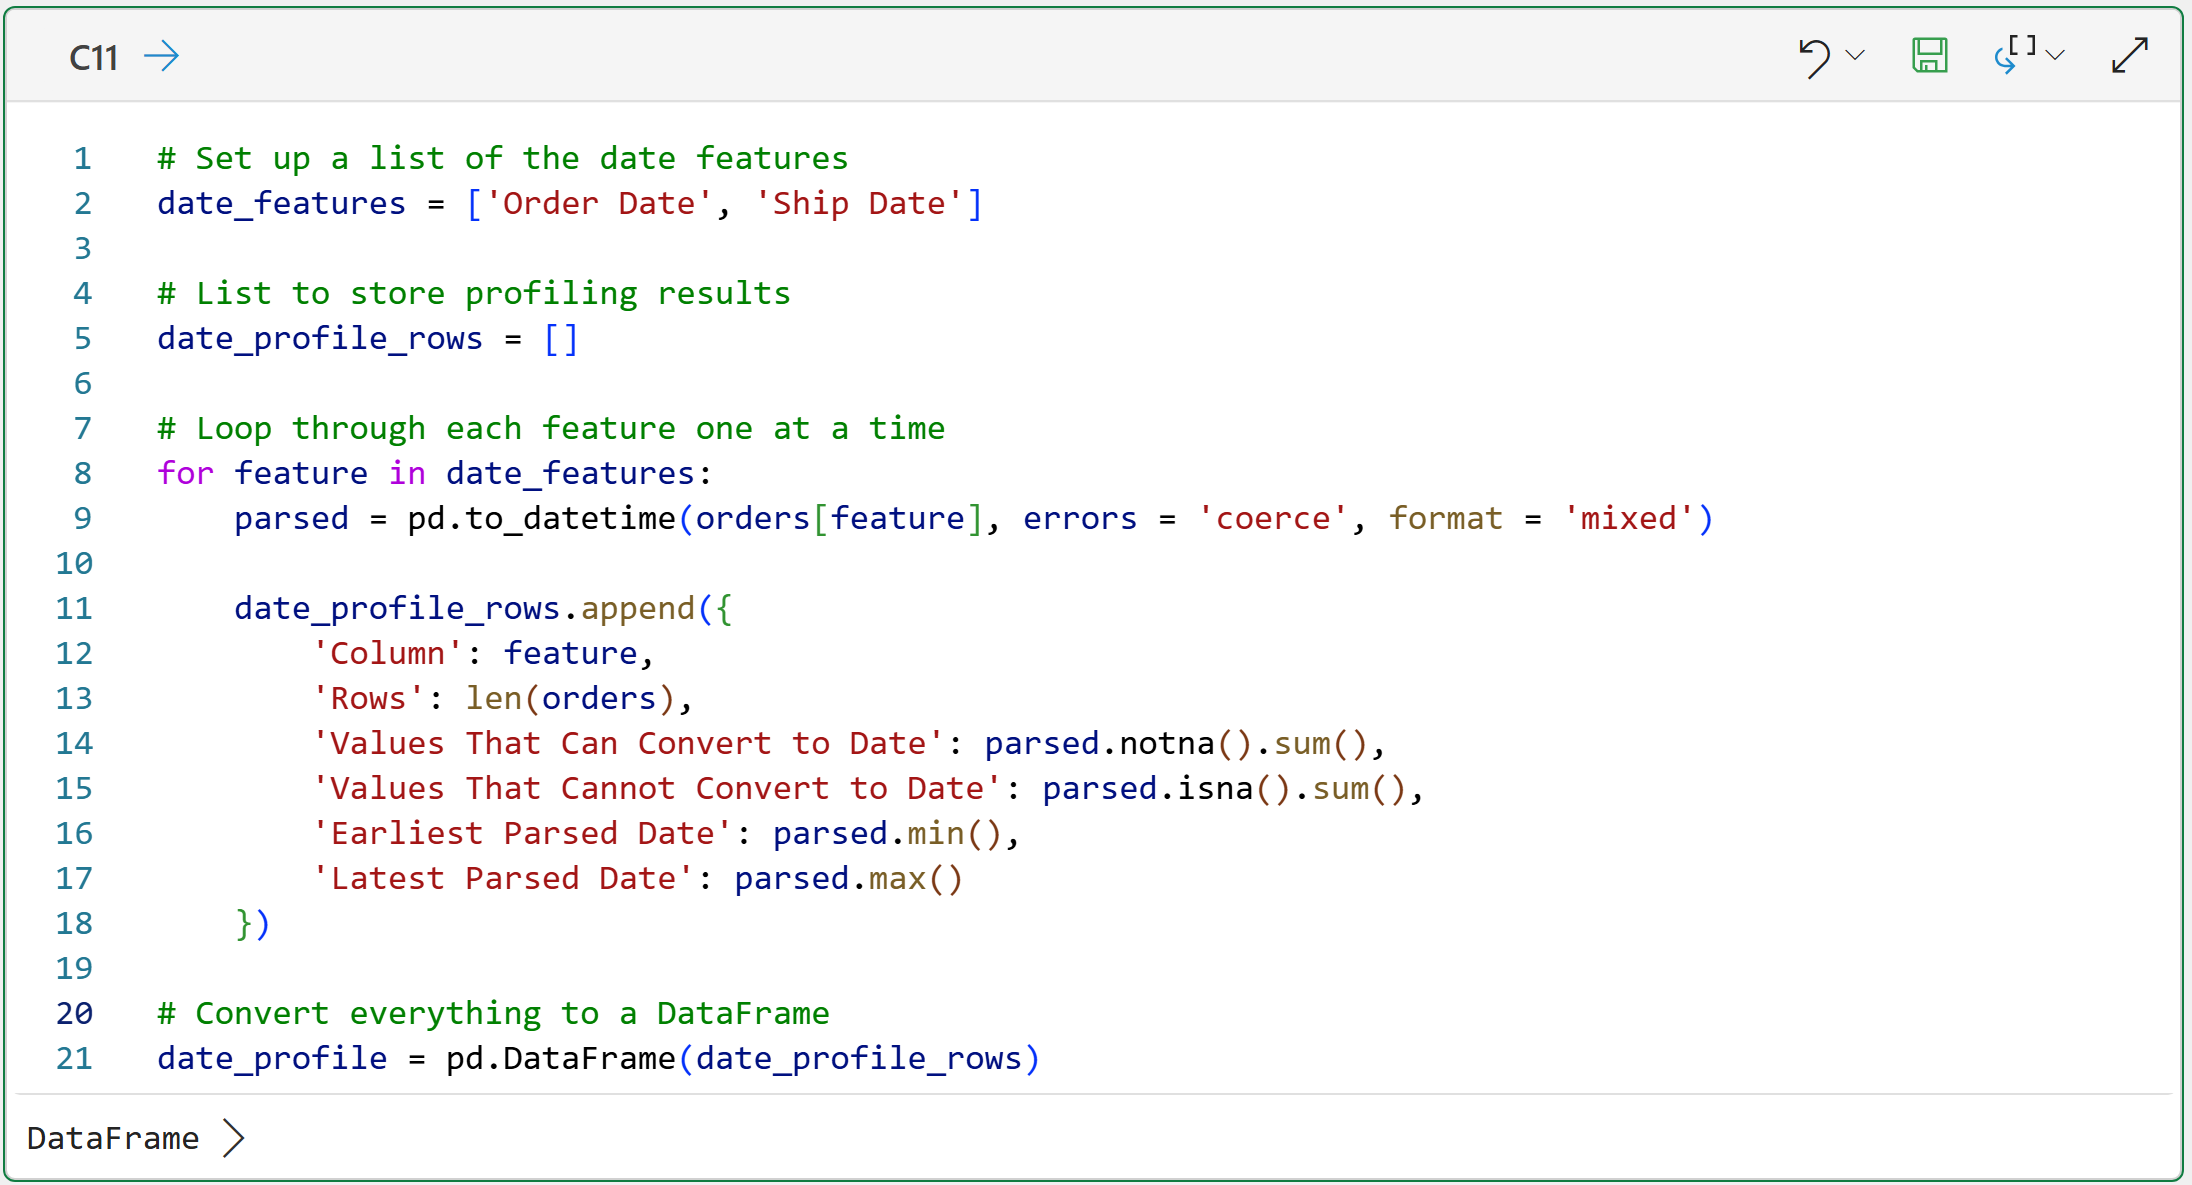
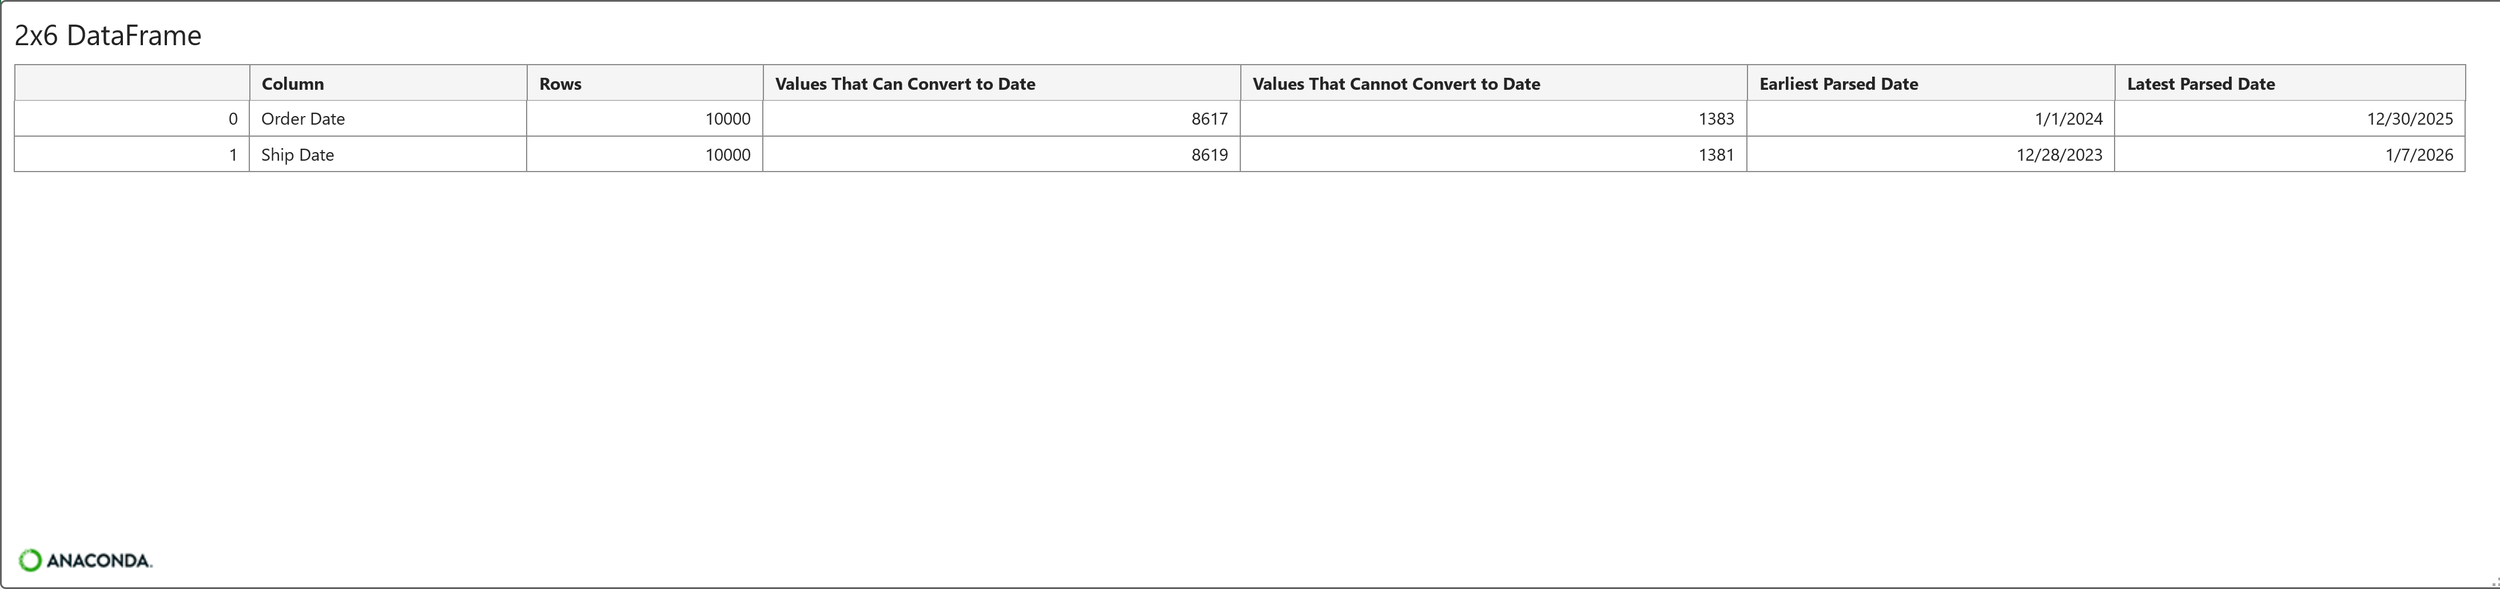
Again, you are not permanently fixing the dates yet. You are profiling.
Date parsing is especially tricky because dates can appear in many formats:
2025-01-31
1/31/2025
01/31/25
Jan 31, 2025
Those may all represent the same date from a business perspective. But software needs explicit instructions.
You will clean the date and time data later in the series.
Step 10: Check for Suspicious Date Relationships
Profiling is not only about checking whether columns can be converted. It's also about checking whether values make business sense.
For example, an order should usually ship on or after the order date. Here's some code to profile this:
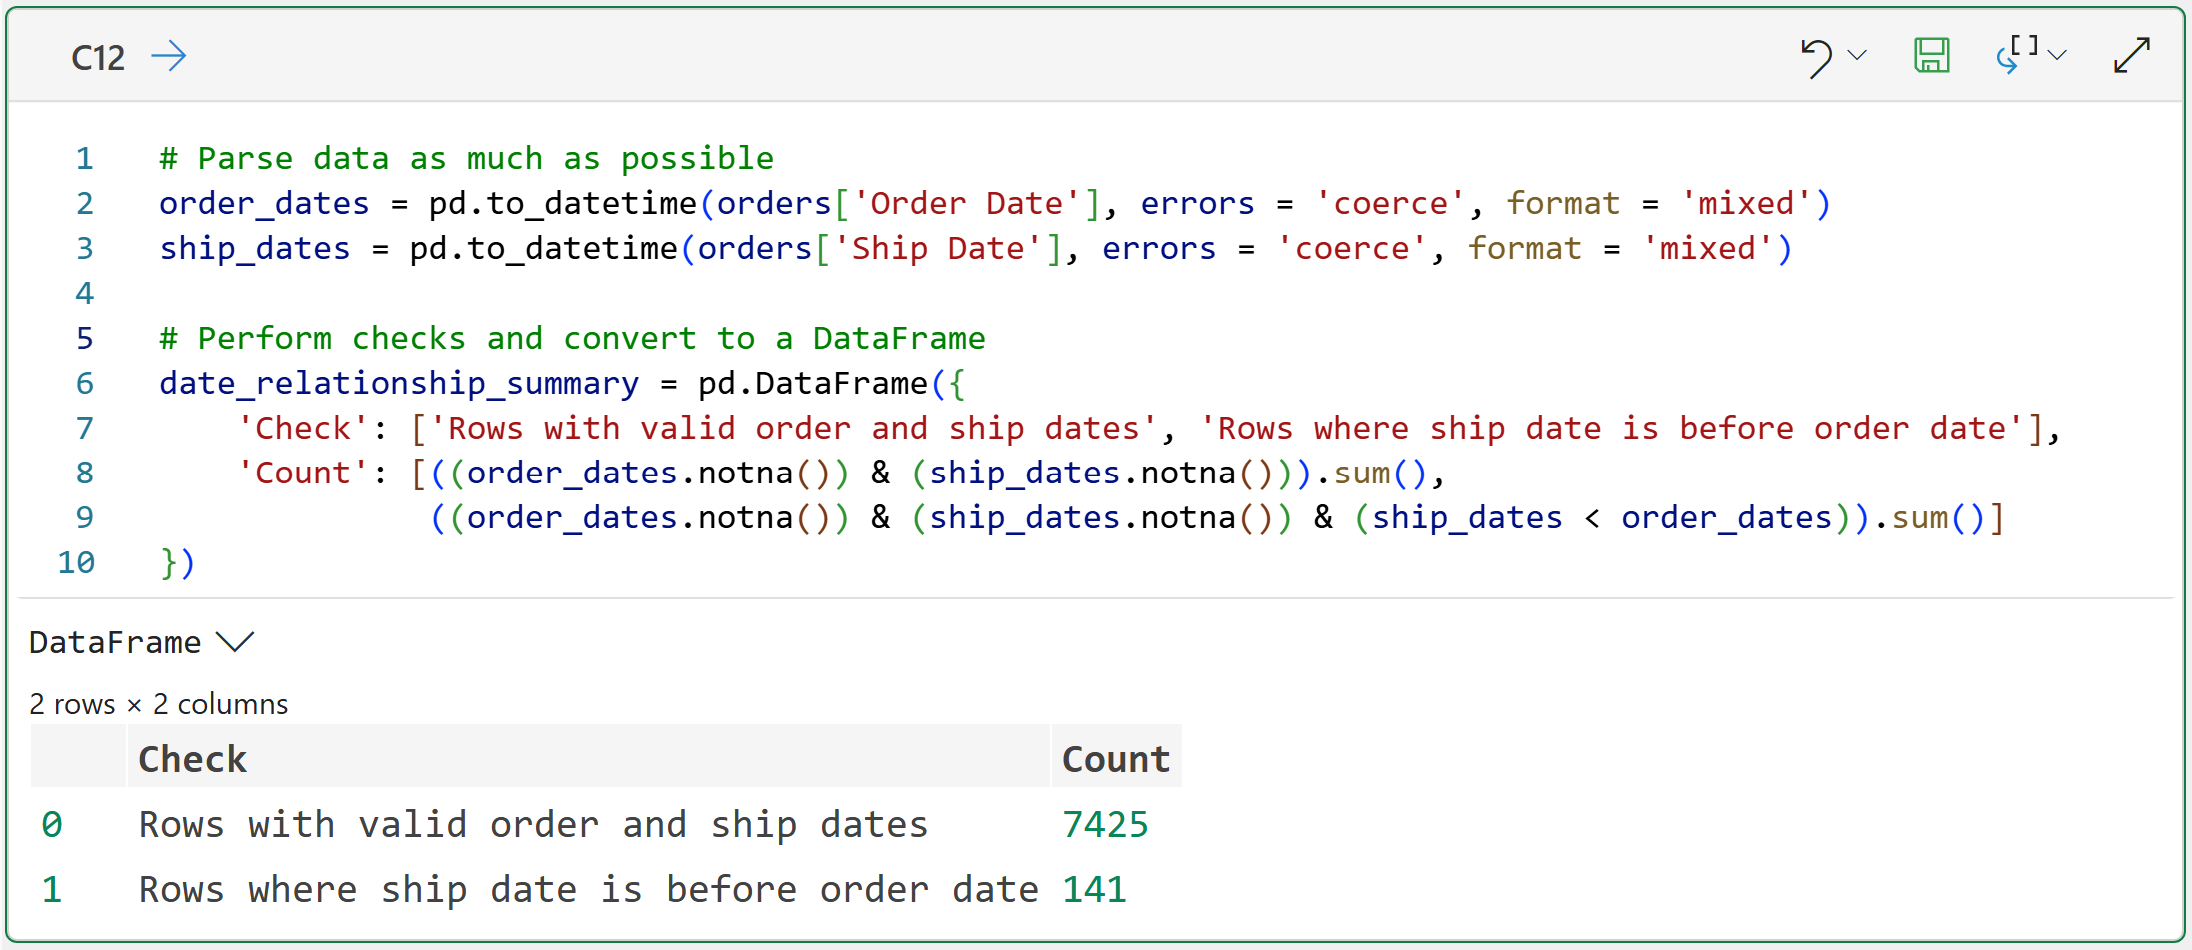
This is an example of a business rule check. The data may be technically valid but still suspicious.
For example, a ship date before the order date is still valid (i.e., from a technical perspective). It's probably just not a valid business event.
This is one of just many patterns of business rule checks you should implement. That's why data cleaning requires both technical skills and business knowledge.
Step 11: Build a First-Pass Data Quality Report
It's very handy to combine several checks into one report. This report will not catch every possible problem. That's OK. The goal is to create a useful first-pass summary.
Here's the code and output:
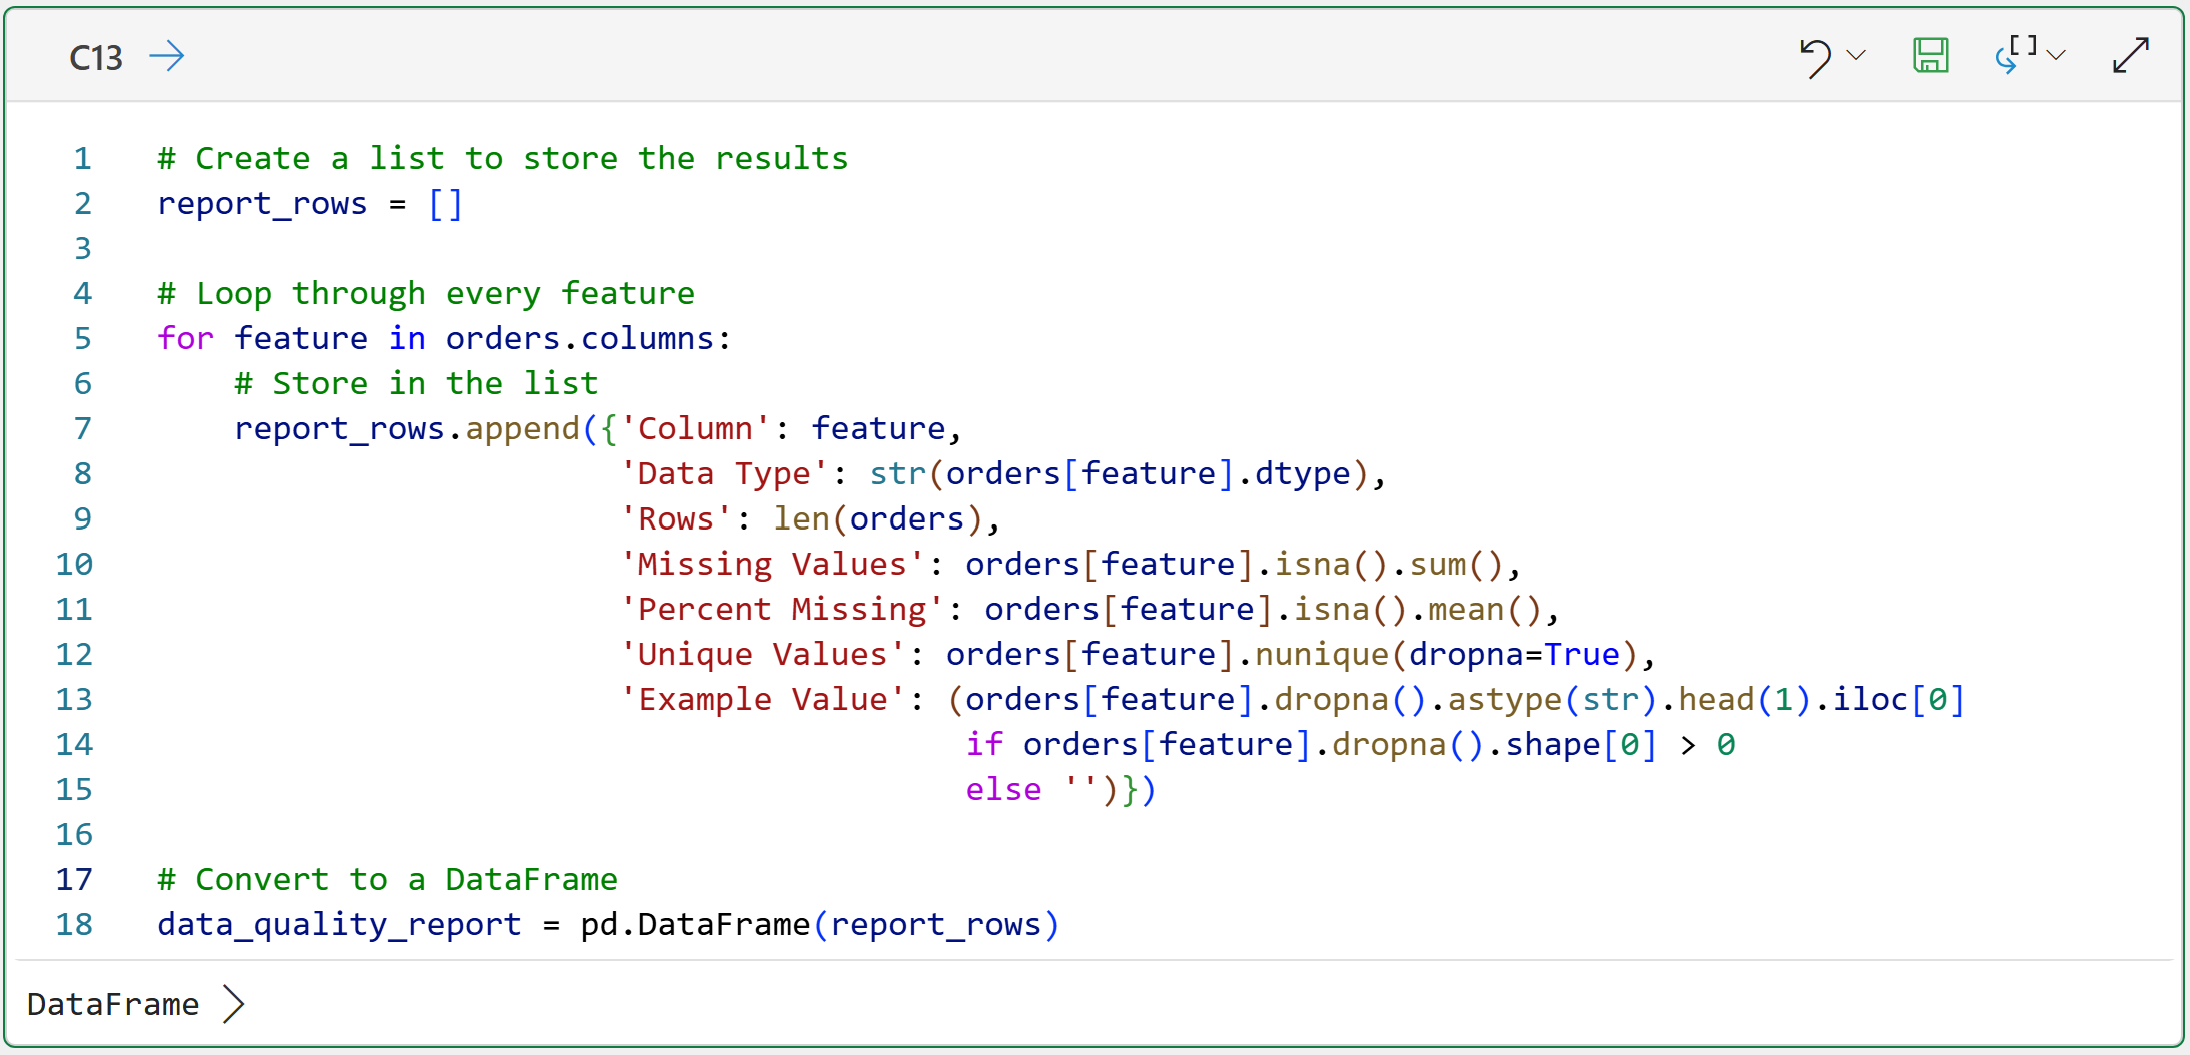
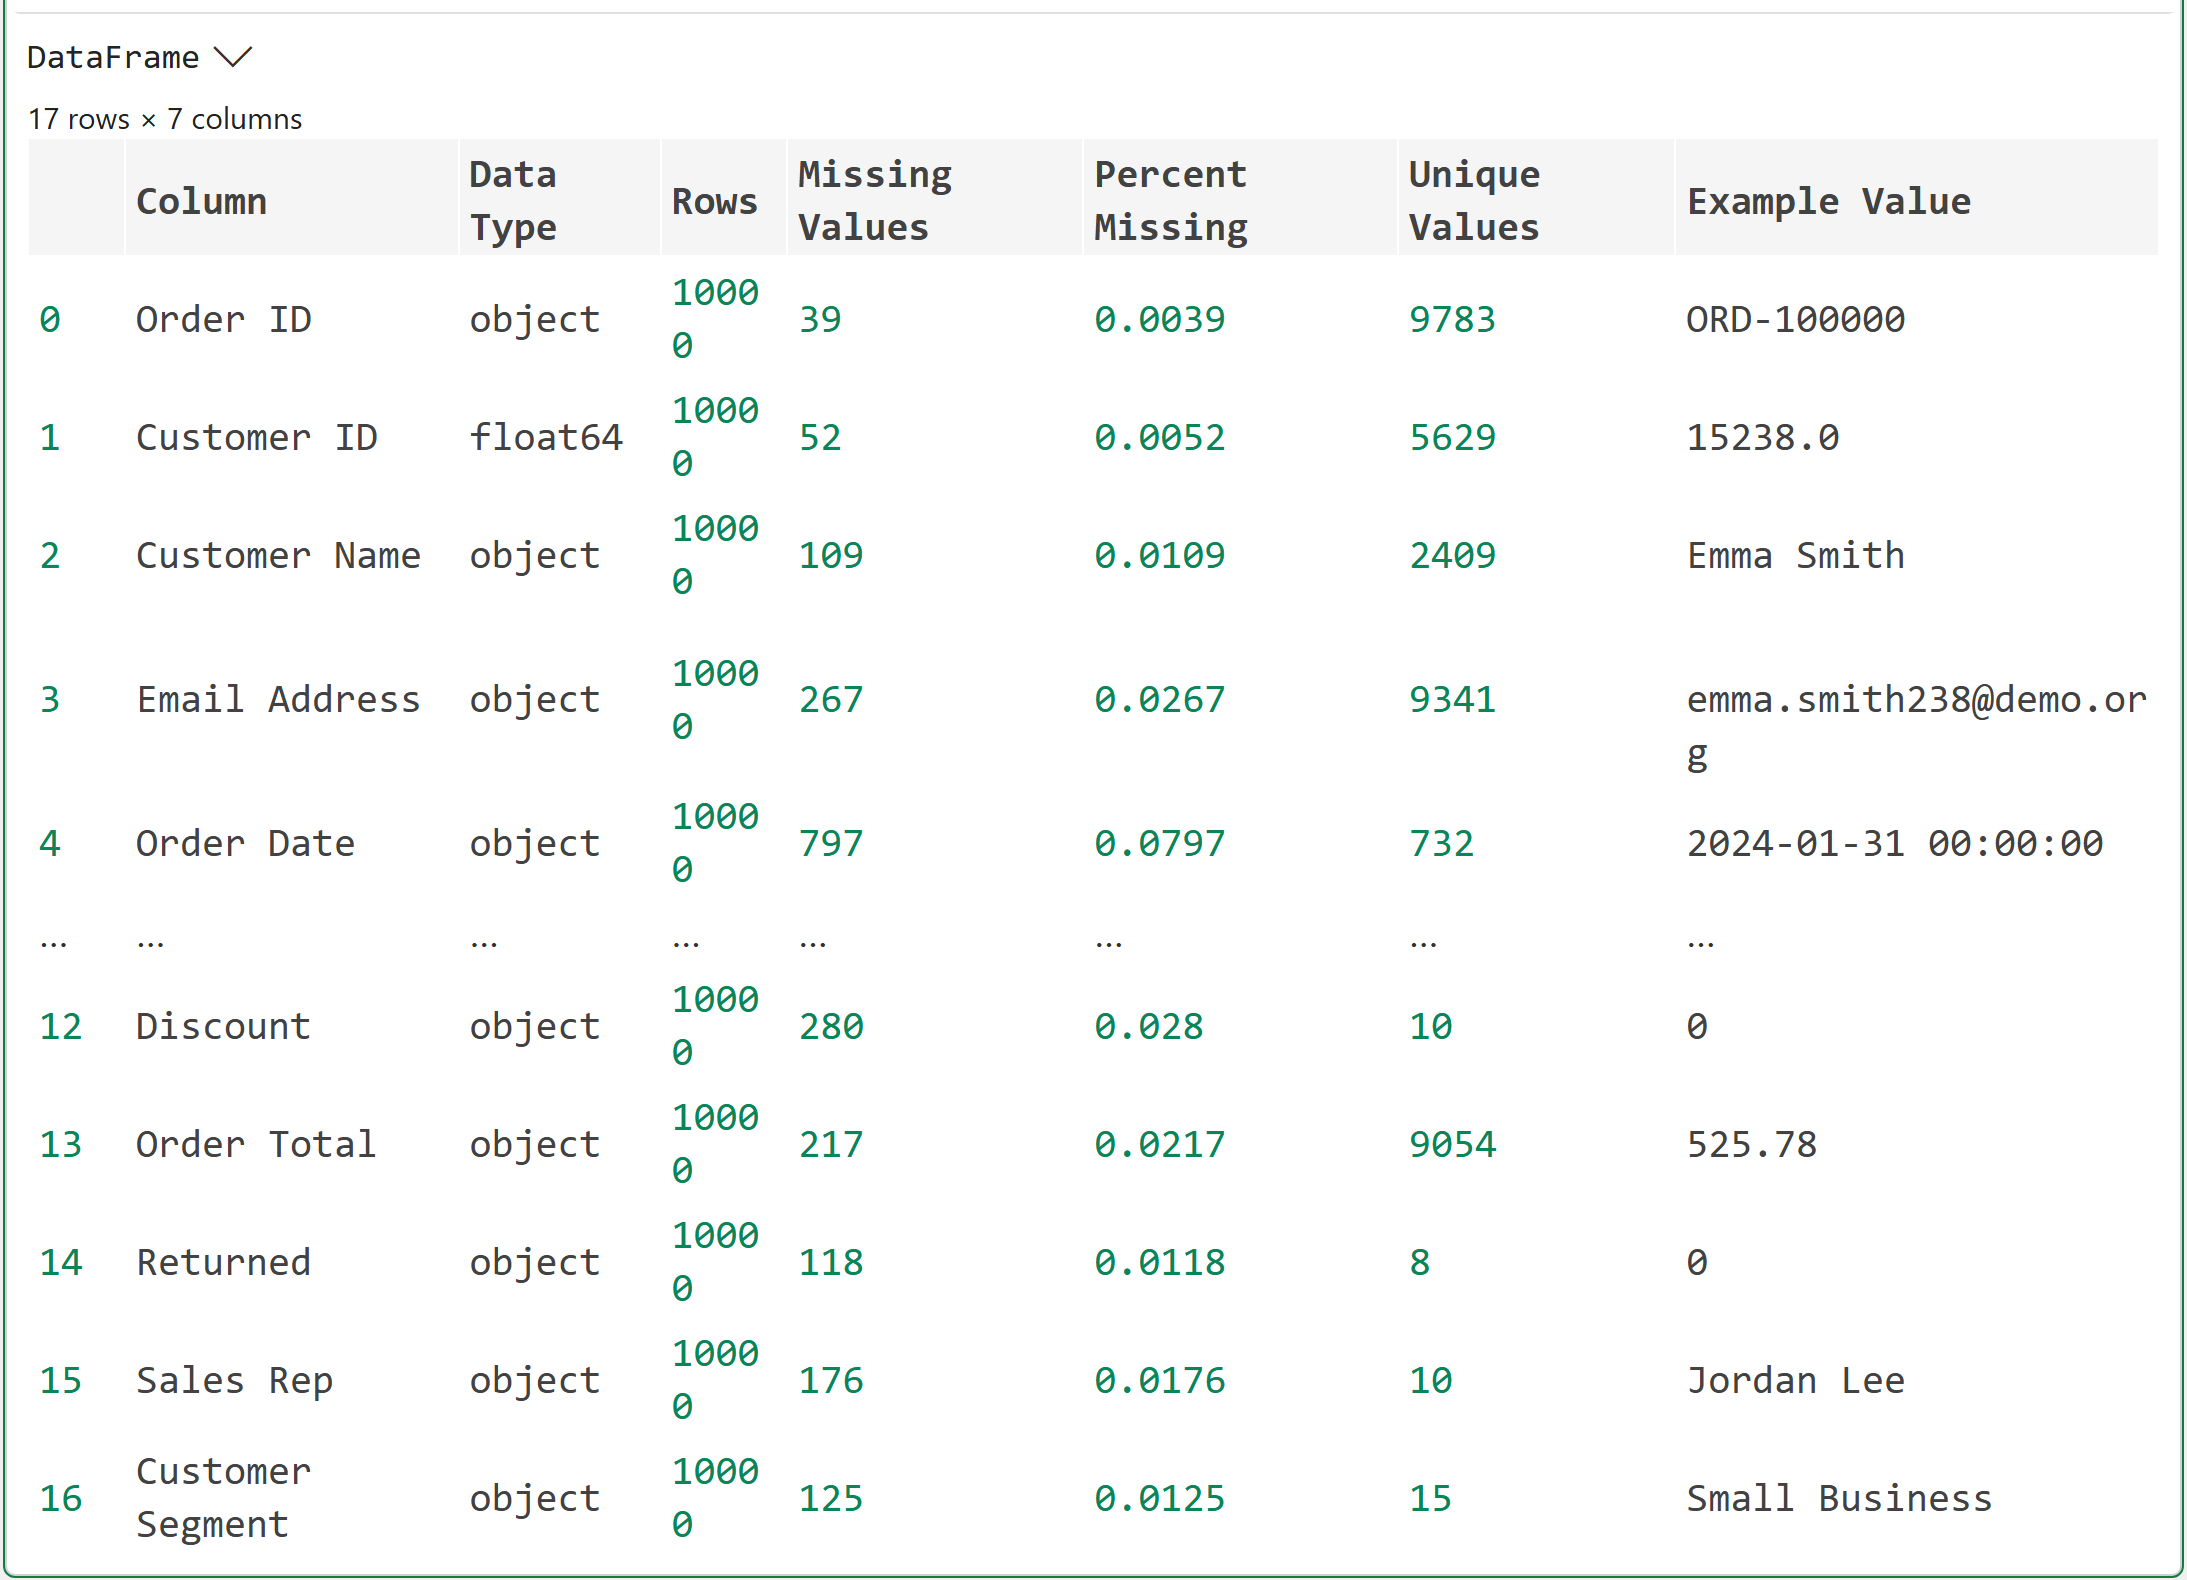
This is a useful DataFrame to keep around. It gives you a repeatable way to inspect a dataset before cleaning it.
And that is the big idea of this tutorial:
Profiling turns data cleaning from guessing into dia
Diagnosis.
What Have You Learned So Far?
After profiling this dataset, you have evidence that it contains several common data quality problems. You found signs of:
Messy column names
Missing values
Duplicate rows
Repeated Order IDs
Inconsistent categorical labels
Numeric columns stored as text
Values that may not convert cleanly to numbers
Mixed date formats
Values that may not convert cleanly to dates
Suspicious business relationships, such as ship dates before order dates
That's a lot. But it's also normal. Real-world data is messy.
The important thing is not to panic or start randomly fixing values.
The important thing is to build a clear inventory of problems.
A Simple Profiling Checklist
When you receive a new dataset, start with these questions:\
How many rows and columns are there?
What are the column names?
Are any column names messy?
What data type does each column currently have?
Which columns have missing values?
Are there exact duplicate rows?
Are there repeated business keys?
Do categorical columns have inconsistent labels?
Do numeric-looking columns actually convert to numbers?
Do date-looking columns actually convert to dates?
Do the values make business sense?
This checklist will not solve every data cleaning problem.
But it will catch many of the problems that regularly occur in your analytics work.
Practice Exercise
Before moving to Part 2, try answering these questions using the profiling tables you created:
Which columns have missing values?
Which categorical column looks the messiest?
Which numeric-looking column has the most values that cannot be converted cleanly to numbers?
Do any order IDs appear more than once?
Do any ship dates appear before order dates?
Which issue would you fix first if your goal were to analyze sales by region?
Do not worry about having perfect answers.
The point is to practice looking at the data before changing it.
Key Takeaway
Data cleaning should not start with cleaning. It should start with profiling. Profiling helps you understand:
What the dataset contains
What is missing
What looks inconsistent
What might be stored using the wrong data type
What might violate business rules
Once you have that information, you can make better cleaning decisions.
That's it for this week.
In the next tutorial, you will start fixing one of the most important problems:
Columns that look like one data type but are actually stored as another.
Stay healthy and happy data sleuthing!

Dave Langer
Whenever you're ready, here are 3 ways I can help you:
1 - The future of Microsoft Excel is unleashing the power of do-it-yourself (DIY) analytics using Python in Excel. Do you want to be part of the future? My Python in Excel Accelerator online course will teach you what you need to know, and the Virtual Dave AI tutor is included!
2 - Are you new to data analysis? My Visual Analysis with Python online course will teach you the fundamentals you need - fast. No complex math required, and the Virtual Dave AI Tutor is included!
3 - Cluster Analysis with Python: Most of the world's data is unlabeled and can't be used for predictive models. This is where my self-paced online course teaches you how to extract insights from your unlabeled data. The Virtual Dave AI Tutor is included!