
Join 1,000s of professionals who are building real-world skills for better forecasts with Microsoft Excel.
Issue #29 - Market Basket Analysis Part 4: Targeted Analysis
This Week’s Tutorial
This week's tutorial focuses on performing targeted analyses using market basket analysis (MBA).
If you're new to the newsletter and need to catch up, check out Parts 1-3 of this tutorial series via the newsletter back issues.
As the best way to learn DIY data science is through practice, I highly recommend downloading the data from the newsletter's GitHub repository and following along.
Due to numerous requests, I will be including Python in Excel in addition to Jupyter Notebook in this tutorial. If you're using Python in Excel, you'll want to download the MarketBasketPurchases.xlsx workbook.
Here's where things ended up at the end of Part 3 in Jupyter Notebook:

And in Microsoft Excel:
With the following association rules mined from the data:

When you look at the mined rules above, one thing becomes very clear.
By default, MBA is very much a technique for discovering new and interesting patterns in your data.
This is why grocery store data is a classic example for learning MBA. It's easy to imagine a grocery store chain looking for new ways to boost revenue by creating endcaps in the store or by offering coupons.
However, I need to be crystal clear on the following point,
It's not only retail businesses (e.g., grocery stores) where mining data for new and interesting patterns is valuable. It's applicable in healthcare, government, non-profit, and all for-profit industries.
**BUT**
You're not limited to using MBA just for mining these patterns. You can also use MBA for targeted analyses.
More specifically, you can search any mined association rules for a specific consequent (i.e., the right side of an association rule).
While I will again use grocery store data as an example in this tutorial, the general pattern applies to any data you can think of.
BTW, the next tutorial will discuss general feature engineering patterns for MBA that can be applied to any domain.
While the correct term is consequent, I use a more approachable term when using MBA and explaining the results to my business stakeholders - outcome of interest.
Let's say that our grocery store purchased a large amount of sausage at a low price. To ensure this purchase is profitable, we need to move the product quickly, as our store's shelf space is limited.
We can use MBA to help us identify opportunities to make this happen by making sausage purchases as the outcome of interest. In this example, the association rule takes the following general form:
{antecedent} → {sausage}
The technical term for the left side of an association rule is antecedent. At this stage of the analysis, we don't care what the exact antecedents might be. The goal is to mine the rules, evaluate them, and then make a decision.
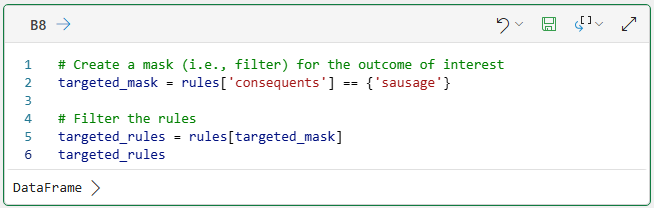
The following Python code in Jupyter Notebook gets only the rules with the outcome of interest:
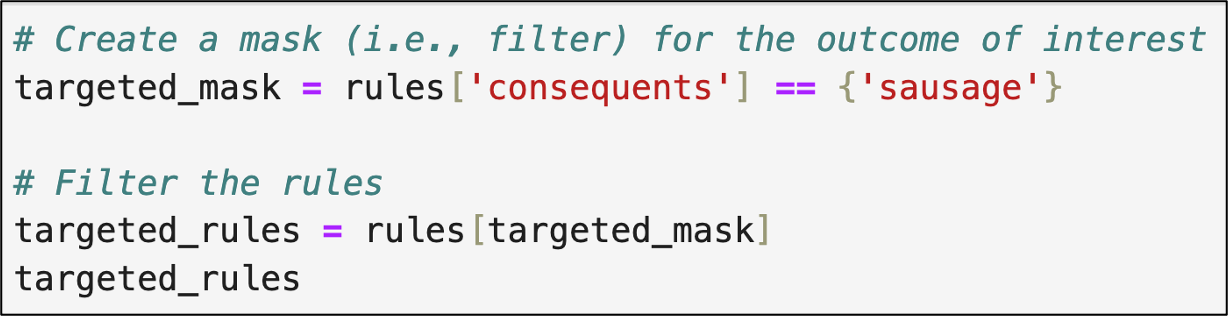
And in Microsoft Excel:
And the association rules filtered for the outcome of interest:
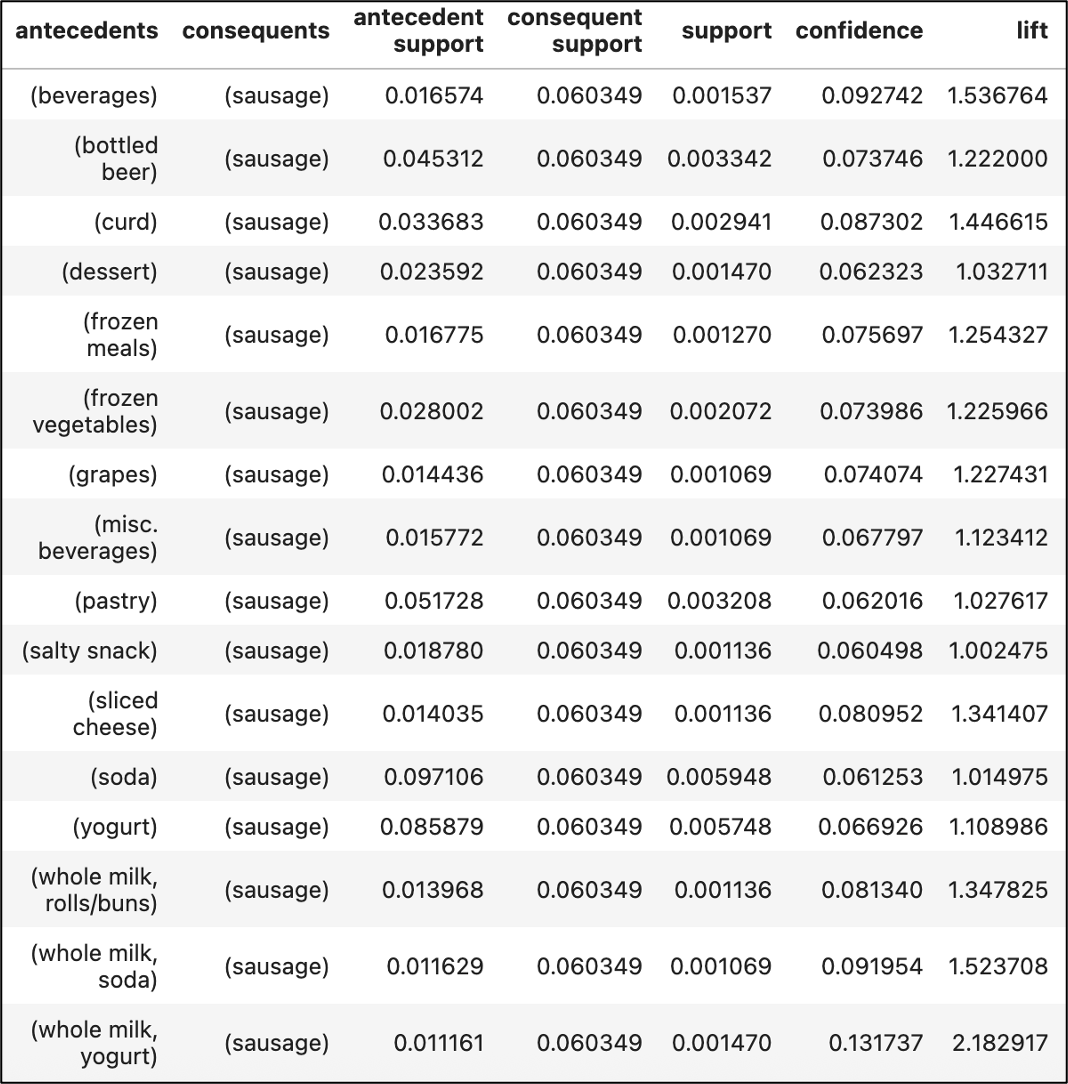
That’s quite a list!
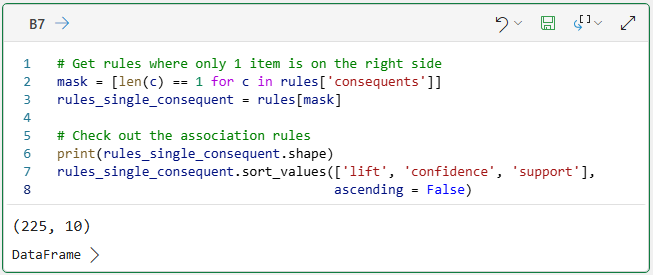
Getting a large number of rules for the outcome of interest is common when using MBA. The following code in Jupyter Notebook sorts the list in descending order based on the lift metric:
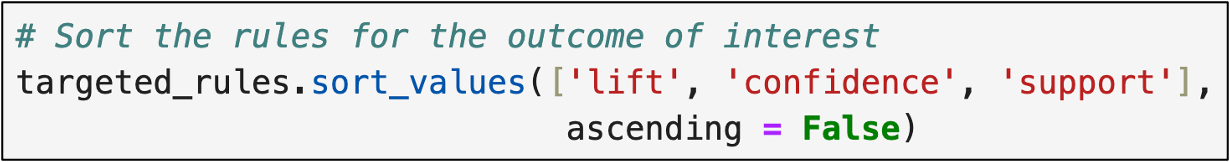
And in Microsoft Excel:
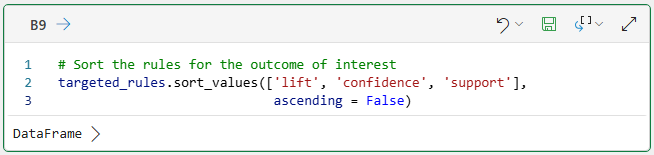
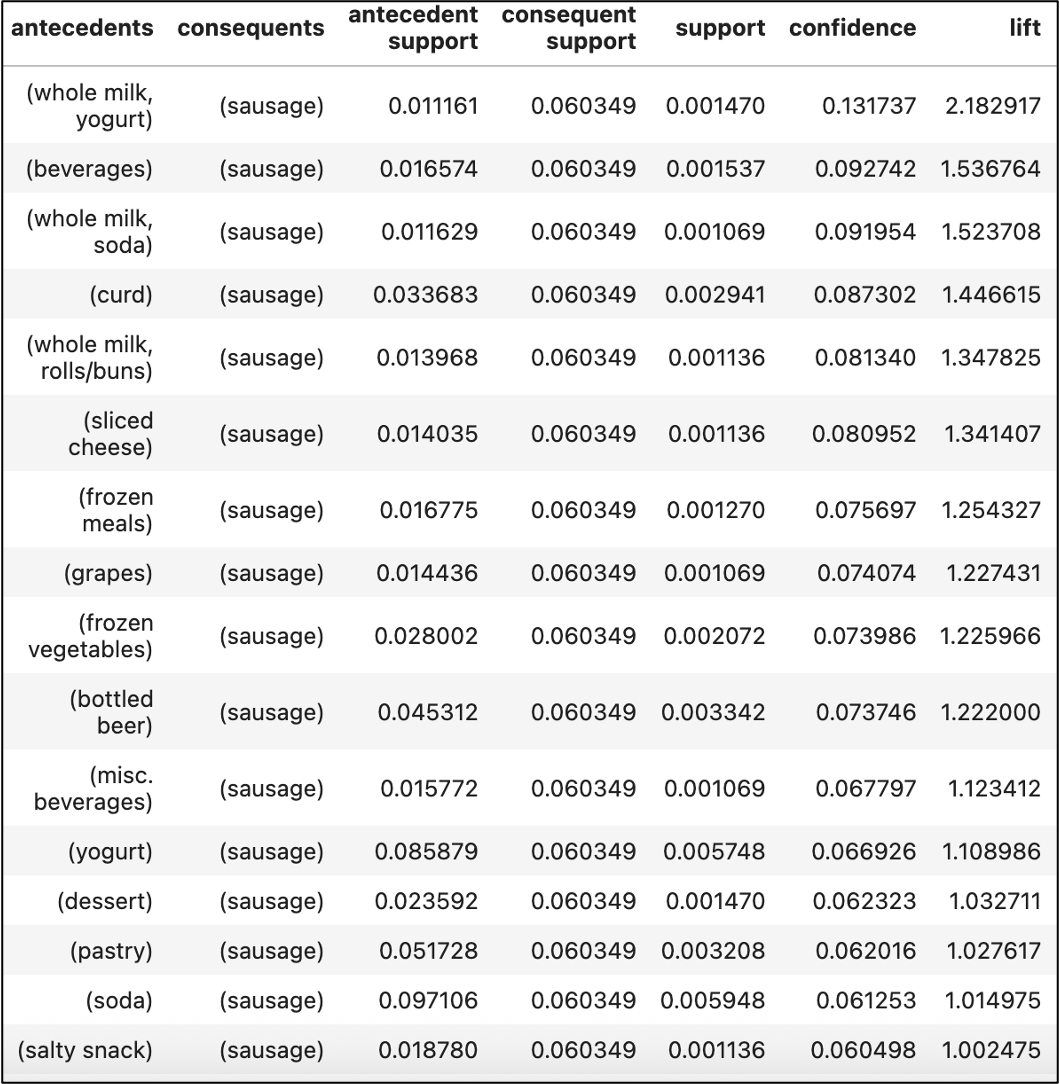
Here are the sorted rules:
When evaluating association rules, here's the process to follow:
Prioritize lift.
Look for high levels of confidence.
Confirm there's adequate support.
These metrics were covered in detail in Part 2, but here's a summary:
Lift tells you how much more likely the outcome of interest is given the antecedent.
Confidence gives you the reliability of the association rule.
Support tells you how frequently the itemset occurs.
Breaking this down for the first rule:
Customers who purchase whole milk and yogurt together are 2.18 times more likely to buy sausage in the same transaction.
13.17% of Customers who purchase whole milk and yogurt together also purchase sausage.
The itemset of {whole milk, yogurt, sausage} represents 0.15% of all transactions.
Here's the intuition for successfully applying MBA: It's a balancing act between two opposing forces.
First, higher lift is typically the result of rarer purchases/interactions/behaviors/etc.
Second, higher support is usually associated (no pun intended) with lower lift.
For example, consider the following association rule from the list above:
{soda} → {sausage}
This association rule has a support metric 4 times higher than the rule with the highest lift. However, this rule shows barely any lift, scoring only 1.014975.
This tradeoff shows how knowledge of business drivers is so essential for the successful application of MBA.
For example, recommending that the store add a refrigerated endcap containing whole milk, yogurt, and sausage solely based on the highest lift score is unlikely to increase sausage sales significantly.
However, running ads/specials featuring beverages and sausage might produce better results, despite a lower lift, because it's more practical from a business perspective.
This is yet just another example of the common theme in DIY data science.
It's all about combining data, technique, and business knowledge.
This Week’s Book
Data modeling is an old topic that has resurfaced as an important concept in analytics. So, here's one of my favorite books on the subject:
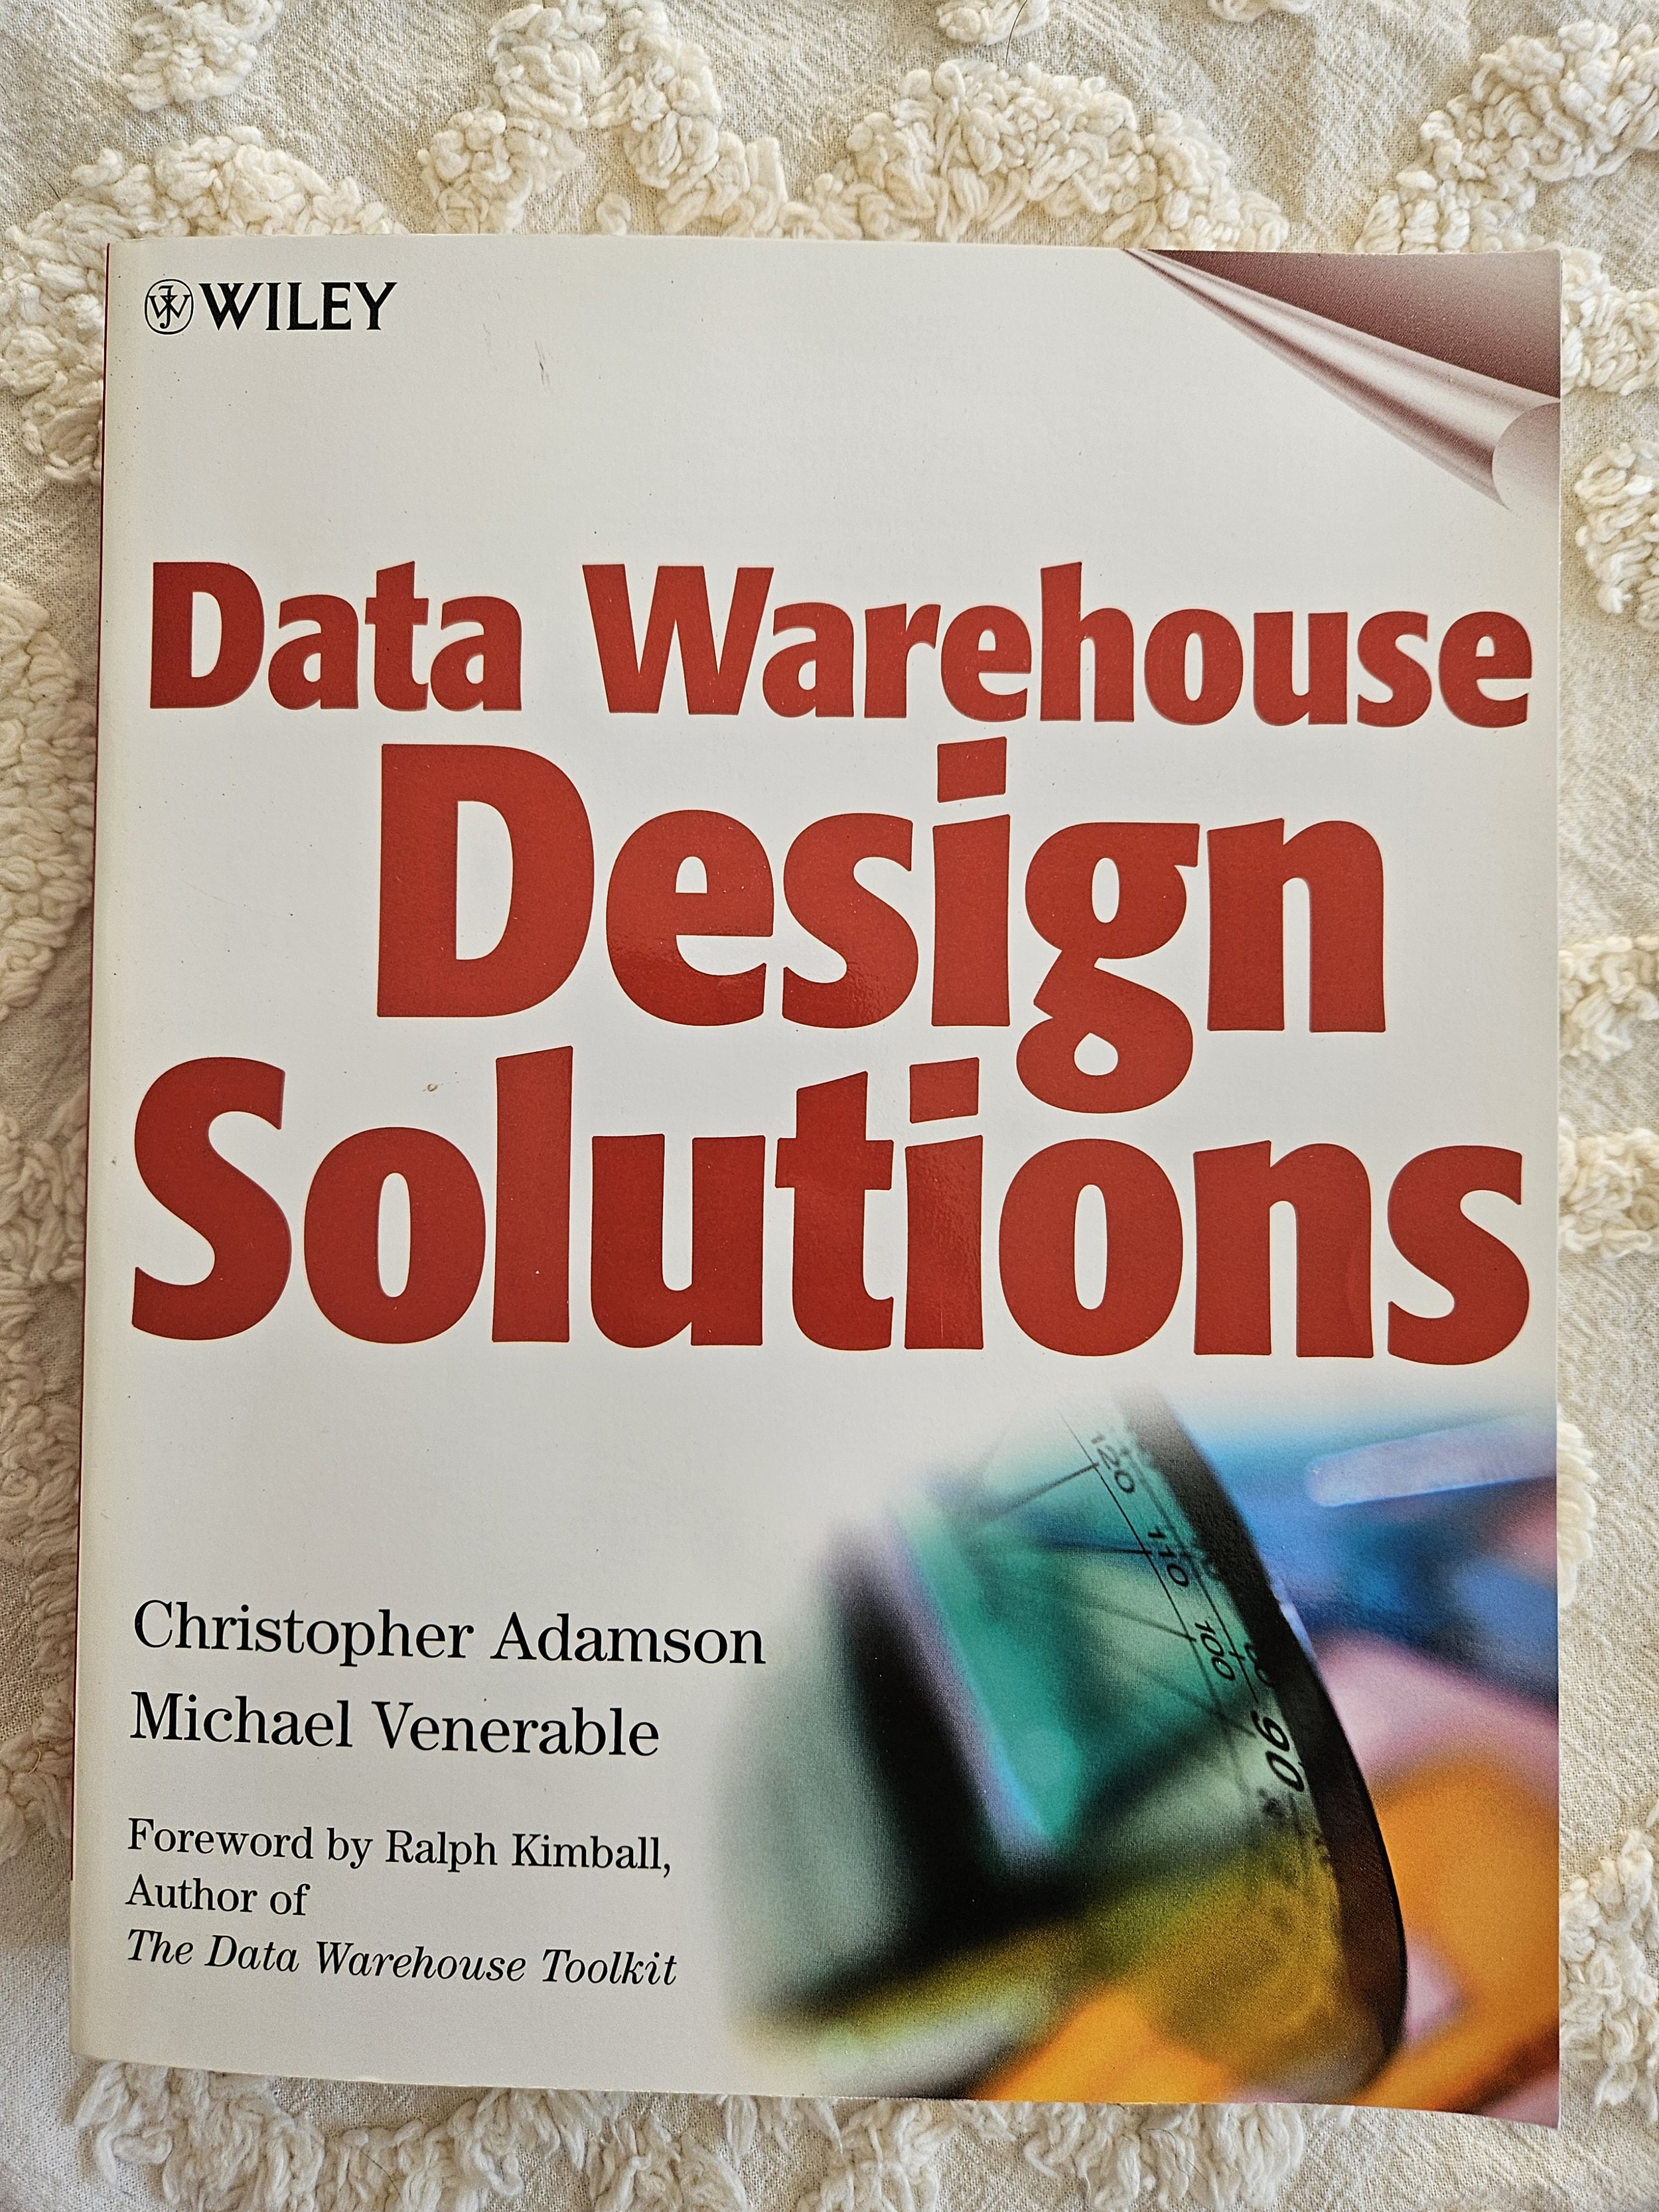
Finding new copies of this book can be difficult. Please don't pay more than retail for it. I saw many used copies available on Amazon for relatively low prices.
That's it for this week.
Next week's newsletter will continue the tutorial series by discussing engineering features for MBA.
Stay healthy and happy data sleuthing!

Dave Langer
Whenever you're ready, here are 3 ways I can help you:
1 - The future of Microsoft Excel forecasting is unleashing the power of machine learning using Python in Excel. Do you want to be part of the future? Order my book on Amazon.
2 - Are you new to data analysis? My Visual Analysis with Python online course will teach you the fundamentals you need - fast. No complex math required, and Copilot in Excel AI prompts are included!
3 - Cluster Analysis with Python: Most of the world's data is unlabeled and can't be used for predictive models. This is where my self-paced online course teaches you how to extract insights from your unlabeled data. Copilot in Excel AI prompts are included!