
Join 1,000s of professionals who are building real-world skills for better forecasts with Microsoft Excel.
Issue #28 - Market Basket Analysis Part 3: Python Code
This Week’s Tutorial
The Python code for market basket analysis is the focus of this tutorial. If needed, check out the previous tutorials in this series via the newsletter back issues.
As the best way to learn DIY data science is through practice, I would highly suggest you download the data from the newsletter's GitHub repository and follow along.
Per many requests, I will be including Python in Excel in addition to Jupyter Notebook in this tutorial. If you're using Python in Excel, you'll want to download the MarketBasketPurchases.xlsx workbook.
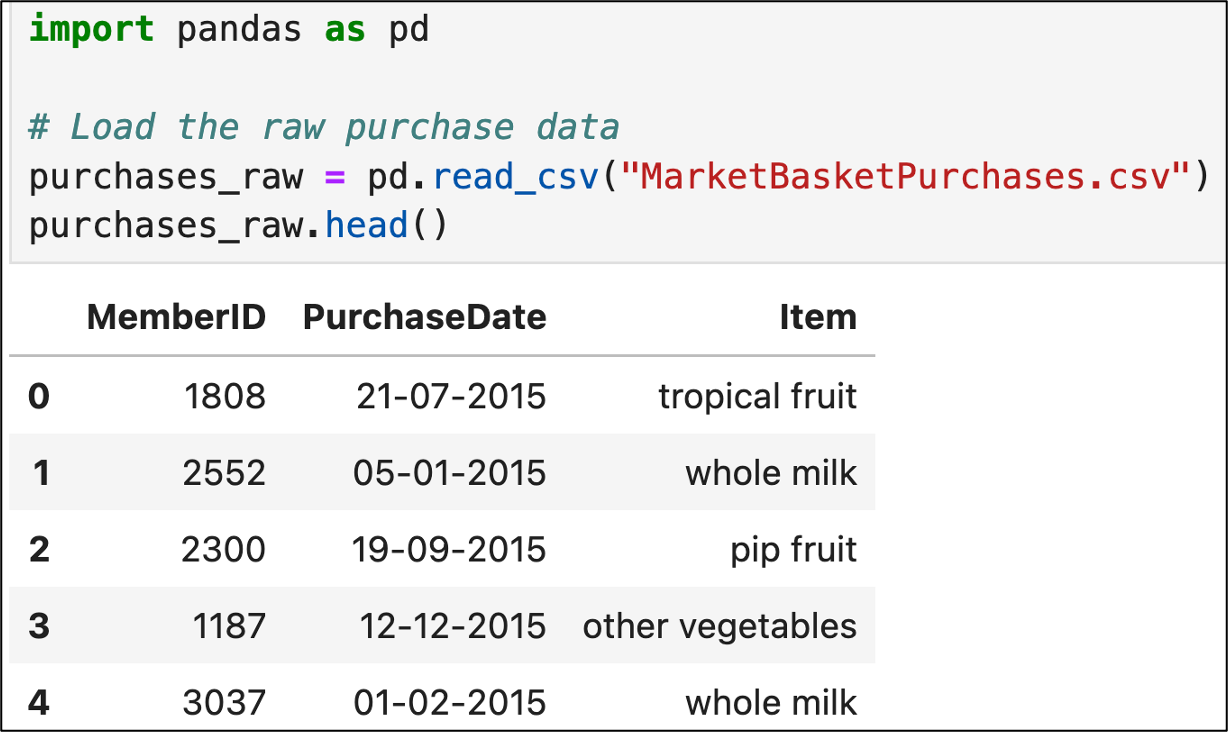
It's common for the raw transactional data used in market basket analysis not to be in the correct format. The data used in this tutorial demonstrates.
In Jupyter Notebook:
And in Microsoft Excel:
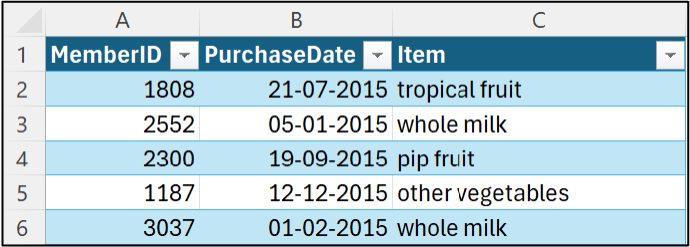
In this dataset, the combination of the MemberID and PurchaseDate columns identifies a single market basket (i.e., a transaction)
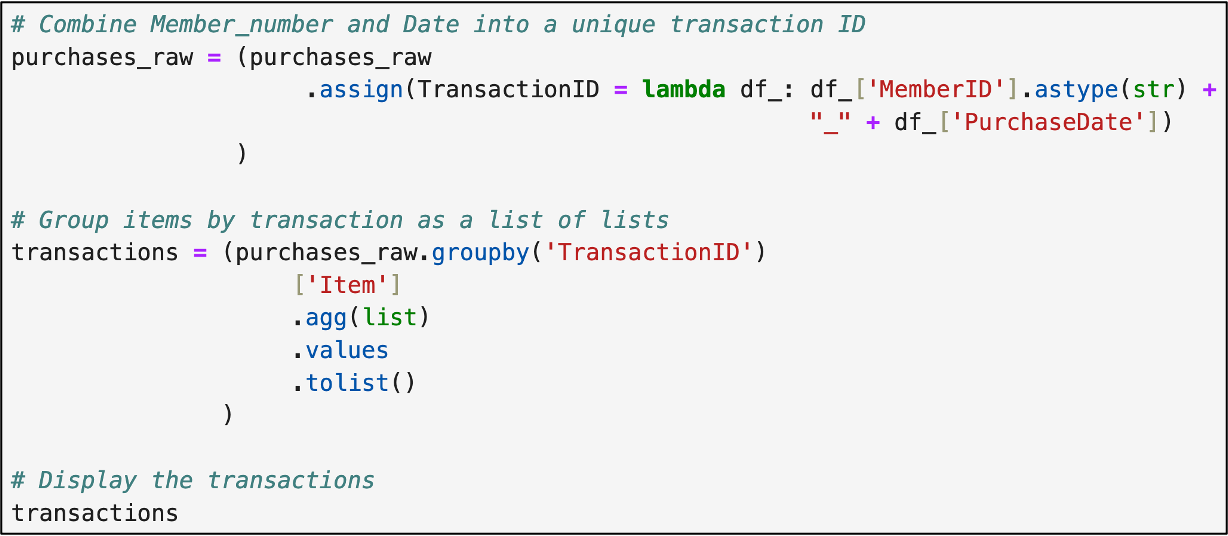
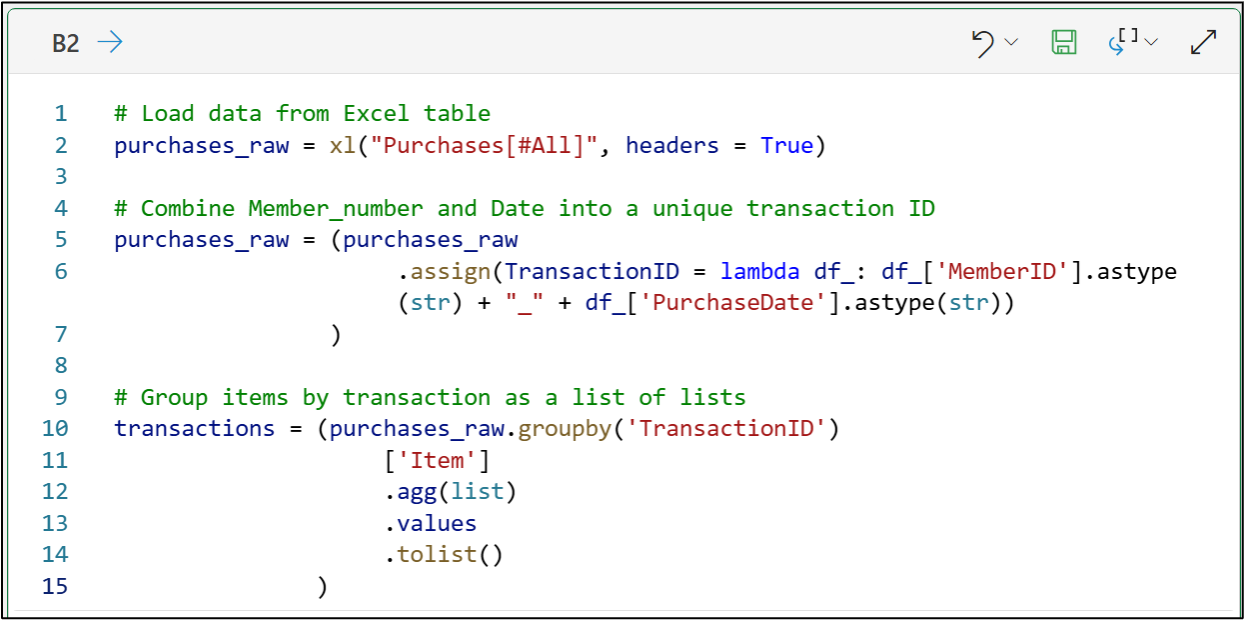
The first step, of course, is to transform the data into a format where each row is a single transaction. In Jupyter Notebook:
To accopmlish the same using Python in Excel:
The most popular Python library for conducting market basket analysis is mlxtend.
While this library is included in Python in Excel (per my request to the Microsoft product team 😁), it's not part of default Python distributions like Anaconda.
The good news it's easy to install via pip and conda. Check out the online installation documentation to learn more.
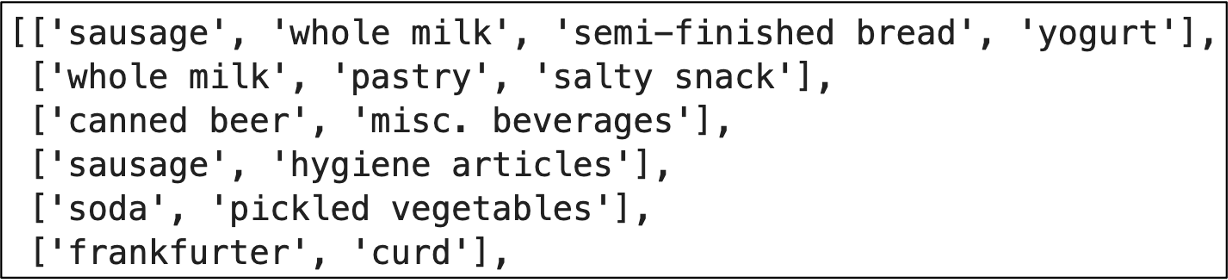
A list of lists is a good way to store market basket analysis (MBA) data because each basket contains different counts of items.
However, lists of lists don't work with the the most popular MBA algorithm (i.e., the apriori algorithm).
So, we can use mlxtend to convert the data into a format suitable for MBA with the apriori algorithm. In Jupyter Notebook:
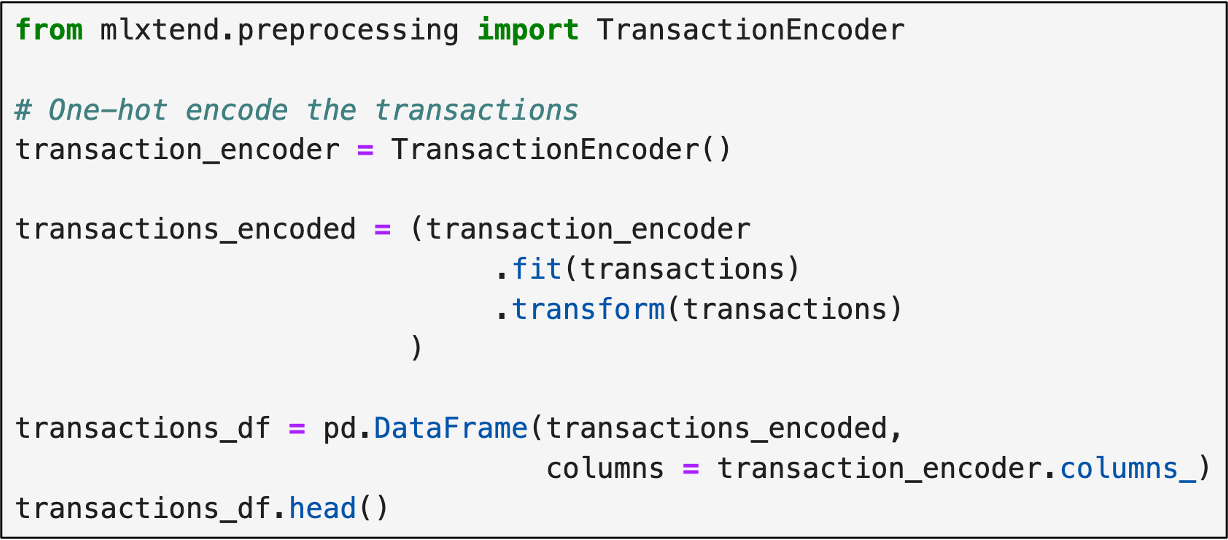

Remember - Python treats False as 0 and True as 1. The mlxtend library will work with either representation.
And using Python in Excel:
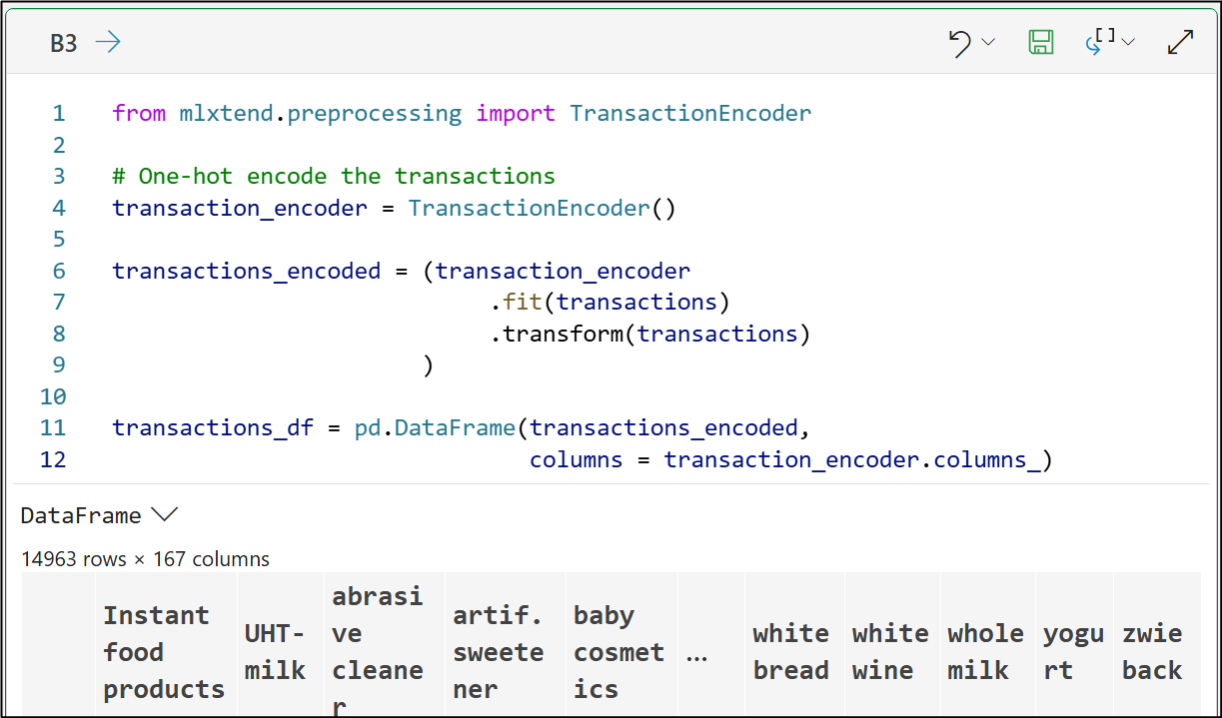
The DataFrame that's produced by the above code is known as a sparse matrix. Here's why:
Every item that is purchased in any transaction gets its own column in the DataFrame.
As most transactions will only contain a small subset of the possible items, most of the DataFrame cells have the value of False (i.e., 0).
As the Trues (i.e., the 1s) are the information, the DataFrame is sparsely populated with information.
Sparse matrices are very common in real-world DIY data science (e.g., text analytics) and can be very large (i.e., your laptop needs a lot of memory to create and use them).
So, when using Python in Excel, it's quite easy to create sparse matrices that are too large to be handled by the secured cloud container.
When this happens, moving to Jupyter Notebooks on your local machine is usually required. The good news is the code is exactly the same.
As we can see in Excel's Python Editor above, there are 14,963 transactions. This is an OK dataset size for Python in Excel.
The next step is to mine the data for frequent itemsets. Intuitively enough, these are just collections of items that show up frequently across all the transactions.
Using mlxtend, we can specify the size of the itemsets we wish to find. For example, we might find the following are frequent itemsets in the dataset:
{UHT-milk, tropical fruit}
{whole milk, yogurt, sausage}
{beef, rolls/buns, citrus fruit, specialty chocolate}
As covered in the previous tutorial, we typically don't want all of the frequent itemsets for our analyses.
We want only those frequent itemsets with a minimum level of support (e.g., appearing in at least 0.1% of the transactions). Setting a minimum support threshold helps to:
Analyze commonly occurring itemsets.
Reduce the number of association rules produced from MBA.
Here's the code for doing this. From now on, I won't distinguish between Jupyter Notebook and Python in Excel:

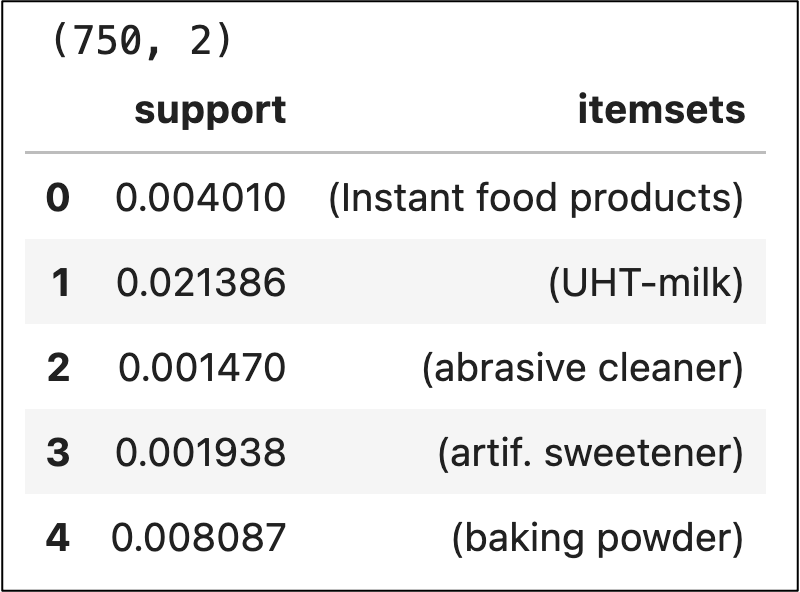

As shown in the output above, there were 750 frequent itemsets found with a support threshold of 0.1%.
As covered in previous tutorials, MBA is an iterative process. Experimenting with various support thresholds optimizes your results.
Support is a critical measure for successful use of MBA because itemsets and association rules with low support might happen purely by chance.
However, don't make the mistake of only considering itemsets and association rules with high support.
For example, you may find that an association rule with a support of 0.1% can lead to very profitable changes to a business process or save your organization a lot of money.
Unfortunately, low support threshold values usually produce very large numbers of association rules for you to analyze.
Consequently, when using MBA, a best practice is to start with a relatively low support threshold and then iteratively increase your support threshold to reduce the number of association rules for you to analyze.
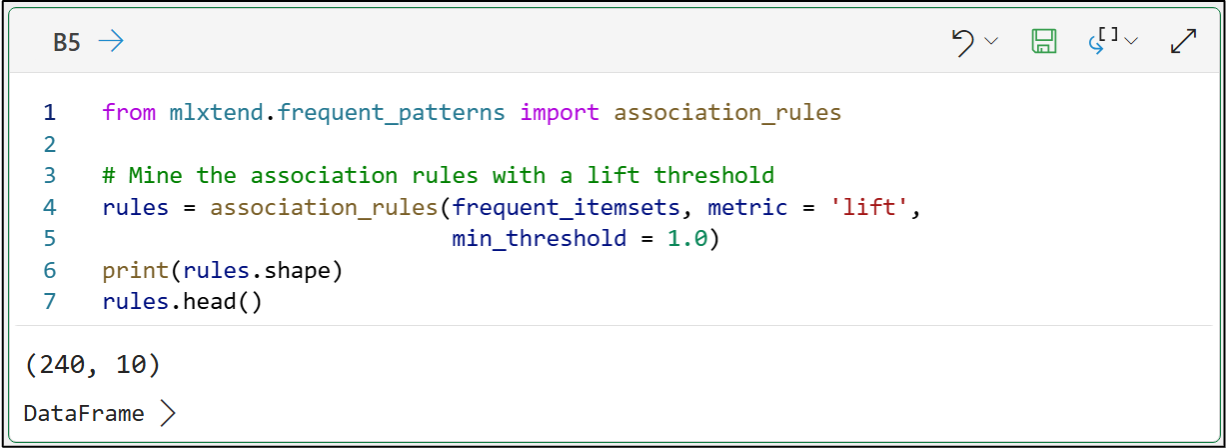
With the frequent itemsets found, we can now mine them for any association rules. The following code use a minimum threshold of 1.0 for the lift metric.
As covered in the previous tutorial, lift scores less than 1.0 mean that the right side of the association rule is less likely to happen because of what's on the left side:


BTW - Because the code is exactly the same, I won't be showing Python in Excel for the rest of this tutorial.
The output above shows that 240 association rules were mined from the frequent itemsets using a lift threshold of 1.0.
A higher lift threshold would reduce the number of rules, while lowering would increase the number of rules. This is one aspect of MBA which requires experimentation to find an optimal value.
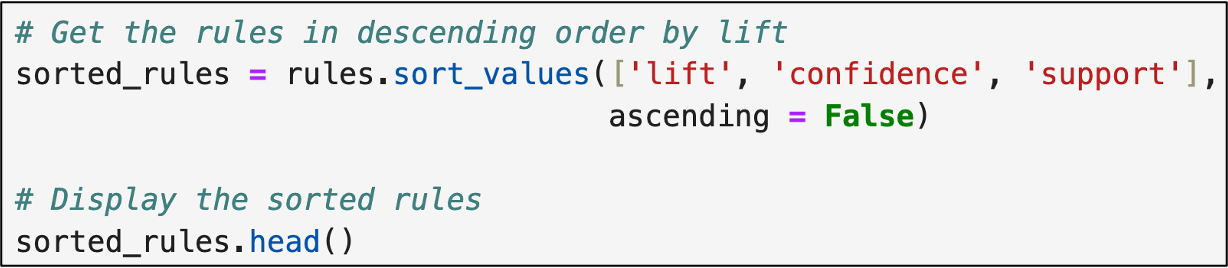
Typically, it's most useful to sort the association rules in descending order based on lift:

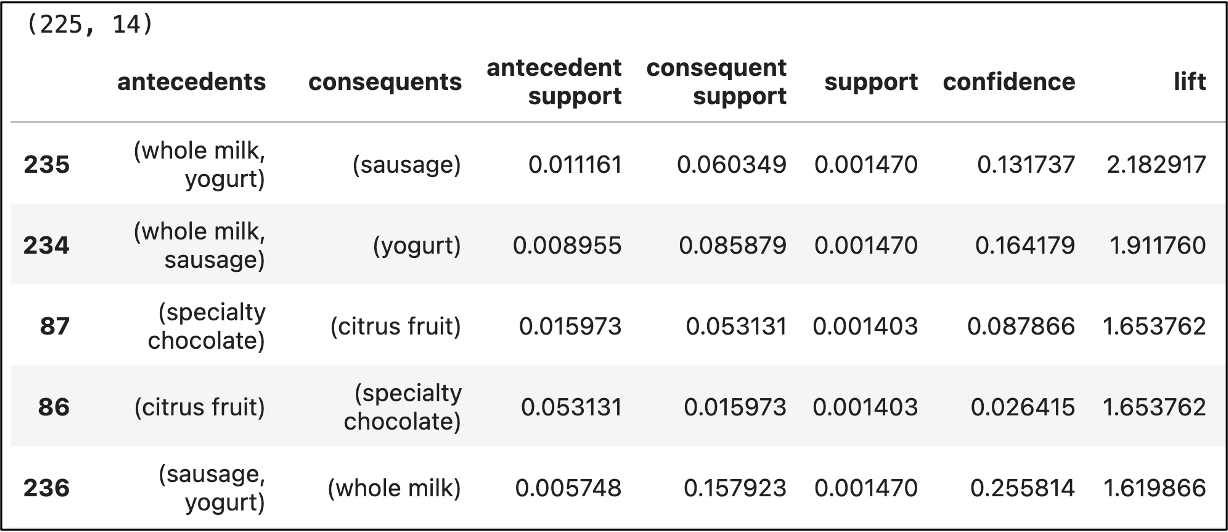
The above output deserves some explanation:
The antecedent is the left side of an association rule.
The consequent is the right side of an association rule.
Using the table output above, the first row (i.e., association rule) can be represented as:
{whole milk, yogurt} → {sausage}
For this rule, the lift metric tells us that customers who purchase {whole milk} and {yogurt} together are 2.18 times more likely to purchase {sausage} compared to purchasing items independently.
This is why, in my experience, business stakeholders love MBA - they can easily understand the insights and form actionable plans based on the insights.
Now, you might have noticed that the 2nd rule is a mirror image of the first:
{whole milk, yogurt} → {sausage}
{sausage} → {whole milk, yogurt}
This is an expected outcome of MBA, but not particularly useful. In general, using MBA effectively means having a single item on the right side of the rules.
The following code makes this happen:
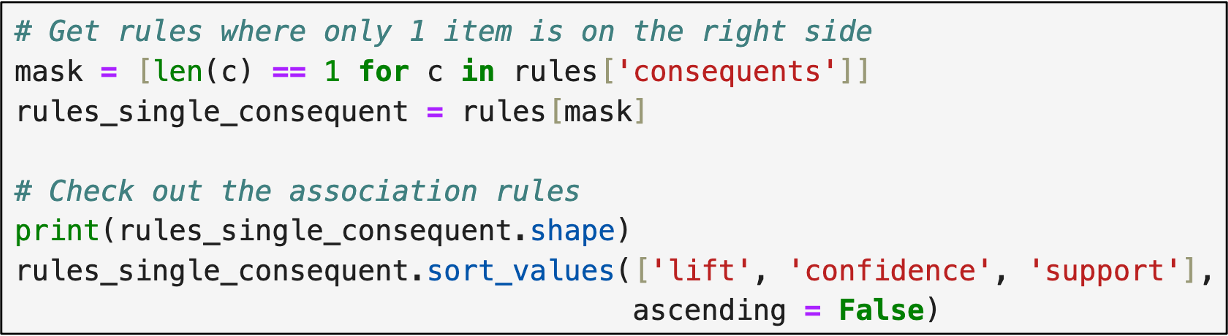
The about output shows that the number of rules dropped from 240 to 215 and produces rules that are much more understandable to business stakeholders.
This Week’s Book
I'm often asked for resources on SQL by professionals looking to enhance their data skills. Here's one of the titles I always recommend:
If you're unfamiliar, SQL window functions are super useful for transforming data into a format needed for DIY data science.
That's it for this week.
Next week's newsletter will continue the tutorial series by demonstrating how to use MBA for more targeted analyses.
Stay healthy and happy data sleuthing!

Dave Langer
Whenever you're ready, here are 3 ways I can help you:
1 - The future of Microsoft Excel forecasting is unleashing the power of machine learning using Python in Excel. Do you want to be part of the future? Order my book on Amazon.
2 - Are you new to data analysis? My Visual Analysis with Python online course will teach you the fundamentals you need - fast. No complex math required, and Copilot in Excel AI prompts are included!
3 - Cluster Analysis with Python: Most of the world's data is unlabeled and can't be used for predictive models. This is where my self-paced online course teaches you how to extract insights from your unlabeled data. Copilot in Excel AI prompts are included!