
Join 1,000s of professionals who are building real-world skills for better forecasts with Microsoft Excel.
Issue #27 - Market Basket Analysis Part 2: Communicating Results
This Week’s Tutorial
If you want to be a successful DIY data scientist, don't make the same mistake I made early in my data science journey:
Failing to realize that technical skills are a means to an end, not the end itself.
Market basket analysis is a prime example of this.
Like so many who get into data science, my focus in my early days was the "cool stuff":
Decision trees
Random forests
K-means clustering
Linear/logistic regression
Don't get me wrong, all of these are powerful tools useful to any DIY data scientist.
But you know who typically doesn't care about how you got to the insights?
Your business stakeholders. Here's what I had to learn the hard way.
The best analytics are those that resonate with business stakeholders and drive changes to business processes - not necessarily the "cool stuff."
This is where market basket analysis can be so effective.
The results of market basked analysis can be summarized using metrics that are easily understood by business stakeholders and the insights are usually perceived as being actionable.
This week's tutorial is all about these metrics and how to use them to communicate your insights with business stakeholders.
**BUT**
We need to first discuss a critical aspect of a successful market basket analysis (MBA) - setting stakeholder expectations.
Like most analytics techniques you will use as a DIY data scientist, MBA mines your data for interesting historical patterns.
In the case of MBA, these patterns take the form of association rules like the following:
If a patient has condition A, they’re more likely to develop condition B.
If someone buys a printer, they often buy ink.
People who buy peanut butter often buy jelly.
It's critical to understand what these association rules actually mean. While there are mathematical definitions for this, all we need is an intuitive understanding.
Take the second bullet above as an example. Using natural language, we could explain this association rule like so:
"We mined our historical data and found that customers that buy a printer also tend to buy ink as part of the same transaction.
However, it's important to note that not every customer buys printers and ink in the same transaction.
Lastly, these insights are based on historical data. There's no guarantee that this behavior will continue in the future."
What the above summarizes is that association rules are not causal relationships. Association rules embody likely outcomes based on your historical data.
Continuing the example, the following are possible customer behaviors:
The customer buys a printer and ink in the same transaction.
The customer buys only a printer.
What the association rule tells you is that, historically, #1 is more likely than #2.
While every business stakeholder dreams of a causal relationship (e.g., for every ad dollar we spend me make $1.5 dollars in sales no matter what), these are exceedingly rare in real-world analytics.
Instead, data-driven organizations mine their data for associations that can be exploited for economic gain (e.g., more sales or lower costs).
MBA is a powerful tool to mine these associations.
Before we dive into the MBA metrics for explaining insights to business stakeholder, we need an example dataset:
{Bread, Milk}
{Bread, Diapers, Beer, Eggs}
{Milk, Diapers, Beer, Cola}
{Bread, Milk, Diapers, Beer}
{Bread, Milk, Diapers, Cola}
As mentioned in Part 1 of this tutorial series, MBA works with any kind of data. However, I will use a grocery store example as it's a classic way to teach MBA.
As was also mentioned in Part 1, quantities don't matter. Were looking for only the presence of items in the transaction.
This means we can represent the above dataset using a pandas DataFrame:
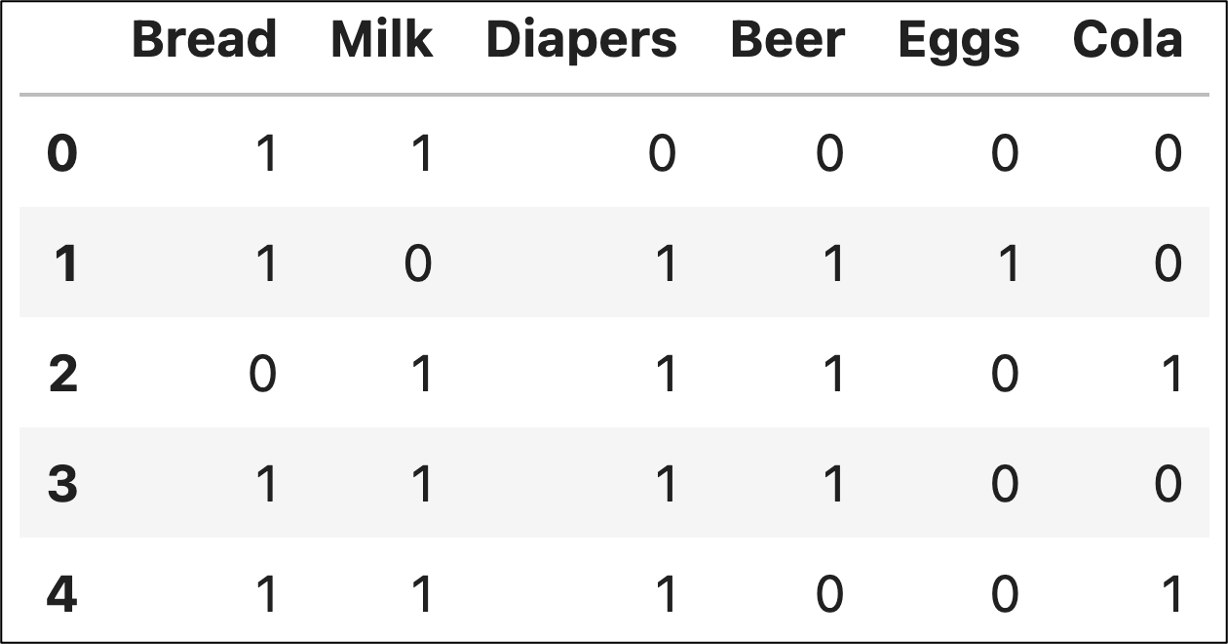
The first MBA metric is support. The support metric tells you how frequently an itemset appears in the dataset.
Using our example data, the following is an itemset that appears in 4 out of 5 transactions:
{Milk}
The support for this itemset is 4 / 5 = 0.8 or 80%.
Now, consider this itemset:
{Milk, Diapers, Beer}
The support for this itemset is 2 / 5 = 0.4 or 40%.
Support is a critical measure for successful use of MBA because itemsets and association rules with low support might happen purely by chance.
However, don't make the mistake of only considering itemsets and association rules with high support (i.e., using a high support threshold).
For example, you may find that an association rule with a support of 10% can lead to very profitable changes to a business process.
Unfortunately, low support threshold values usually produce very large numbers of association rules for you to analyze.
Consequently, when using MBA, a best practice is to start with a relatively low support threshold (e.g., 5%) and then iteratively increase your support threshold to reduce the number of association rules for you to analyze.
The second MBA metric is confidence. The confidence metric gives you an estimate of the reliability of an association rule given your historical data.
Consider the following association rule:
{Milk, Diapers} → {Beer}
In natural language, the above rule can be explained to a stakeholder as follows:
"Customer that purchase Milk and Diapers also tend to purchase Beer in the same transaction."
The confidence metric is calculated by finding the support for all items in the rule:
The support for {Milk, Diapers, Beer} is 2 / 5 = 0.4 or 40%
Divided by the support for the left side of the rule:
The support for {Milk, Diapers} is 2 /3 = 0.67 or 67%
Therefore, the confidence for this rule is 0.4 / 0.67 = 0.597 or 59.7%
Here's how to combine support and confidence using natural language for your business stakeholders:
"About 2/3 of our transactions contain both Milk and Diapers. Of these transactions, 59.7% also contain Beer."
The first sentence explains the support (or frequency) of the left side of the rule. The second sentence explains the confidence (or conditional frequency) of the right side of the rule.
There's an urban legend that a grocery store chain uncovered an association rule between Diapers and Beer. In response, the chain created a display in their stores containing Diapers and Beer to increase sales.
While certainly an amusing story, it does underline how MBA can be understood, and used by, business stakeholders to improve processes.
The third MBA metric is lift. The lift metric addresses a shortcoming of relying only on the support and confidence metrics.
The problem with the confidence metric is it doesn't account for how common the right side of an association rule is in the dataset.
For example, consider this association rule:
{Milk, Diapers} → {Cola}
Let's calculate the confidence for this association rule:
The support for {Milk, Diapers, Cola} is 2 / 5 = 0.4
The support for {Milk, Diapers} is 2 / 3 = 0.67
The confidence is 0.4 / 0.67 = 0.597
So, this association rule looks very much like the previous rule.
**BUT**
Cola purchases are more rare compared to Beer purchases. This is where the lift metric becomes useful.
The lift metric is calculated by dividing the association rule's confidence by the support for the right side of the rule:
The support for {Cola} is 2 / 5 = 0.4
So, the lift for the association rule is 0.597 / 0.4 = 1.49
Now, compare this to the lift for the first association rule:
Support for {Beer} is 3 / 5 = 0.6
Lift is 0.597 / 0.6 = 0.995
And here's where the magic of the lift metric comes into play when explaining your MBA insights to business stakeholders:
"The analysis shows that customers who purchase Milk and Diapers together are 1.5 times more likely to purchase Cola compared to purchasing items independently.
Additionally, the analysis shows that customers who purchase Milk and Diapers together are less likely to purchase Beer compared to purchasing items independently.
Based on the analysis, we could experiment with providing coupons for Cola to customers who regularly purchase Milk and Diapers together."
Now that's what I call using data to drive impact!
This Week’s Book
Causal modeling is a complex topic, but something many professionals want to learn more about. This is a great book to start your journey if you fall into this group:
Don't expect any Python code in this book, but it shows what's possible even using trusty old Microsoft Excel as your first stop in causal modeling.
That's it for this week.
Next week's newsletter will continue the tutorial series on market basket analysis with a focus on MBA metrics that are easily understood by your business stakeholders.
Stay healthy and happy data sleuthing!

Dave Langer
Whenever you're ready, here are 3 ways I can help you:
1 - The future of Microsoft Excel forecasting is unleashing the power of machine learning using Python in Excel. Do you want to be part of the future? Order my book on Amazon.
2 - Are you new to data analysis? My Visual Analysis with Python online course will teach you the fundamentals you need - fast. No complex math required, and Copilot in Excel AI prompts are included!
3 - Cluster Analysis with Python: Most of the world's data is unlabeled and can't be used for predictive models. This is where my self-paced online course teaches you how to extract insights from your unlabeled data. Copilot in Excel AI prompts are included!