
Join 1,000s of professionals who are building real-world skills for better forecasts with Microsoft Excel.
Issue #53 - Forecasting with ARIMA Part 8:
Partnering With AI
This Week’s Tutorial
Last week's tutorial taught you how to add external factors (i.e., exogenous variables) to your ARIMA models. For example, including the months of the year in the hopes that the ARIMA model would learn about seasonality.
If you're new to this tutorial series, you can get all the previous tutorials here - just scroll down to the bottom of the page.
In this tutorial, you're going to see how everything you've learned so far can help you partner with the Copilot in Excel AI to increase your productivity.
I can't stress this enough.
While "vibing" is all the rage right now, vibe analytics doesn't work because there's no way for you to truly validate what the AI produces if you don't have the requisite skills.
This is why top Excel users in 2026 will be building skills with analytics and Python.
If you would like to follow along with today's tutorial (highly recommended), you will need to download the SalesTimeSeries.xlsx file from the newsletter's GitHub repository.
Preparing the Workbook
In this tutorial, I'm going to use Copilot in Excel's advanced analysis mode. I've spent many hours partnering with Copilot in Excel to perform real-world analytics, and this mode is, IMHO, the best way to use AI with Excel.
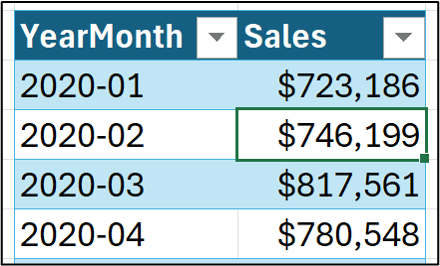
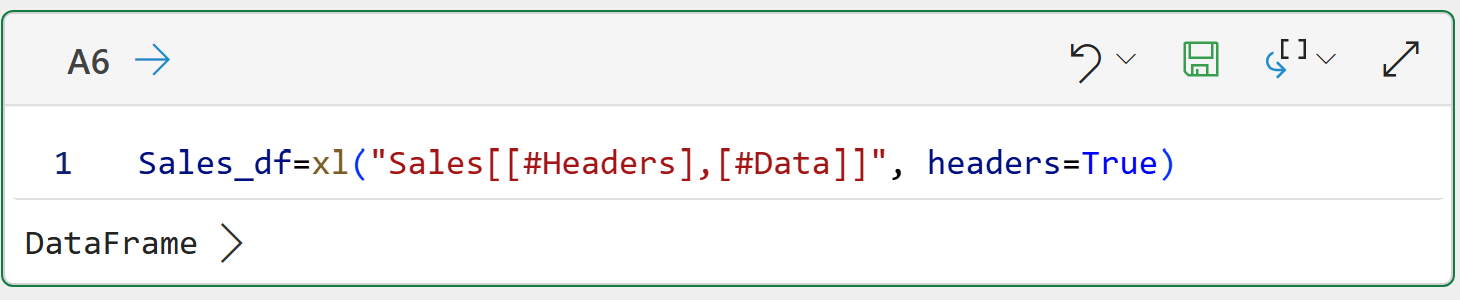
At the time of this writing, you need to do a bit of prep to use Copilot in Excel's advanced analysis model. The first step is to select a cell in the workbook's Sales table:
Next, you need to tell Excel you want to use Copilot in Excel's App Skills mode:
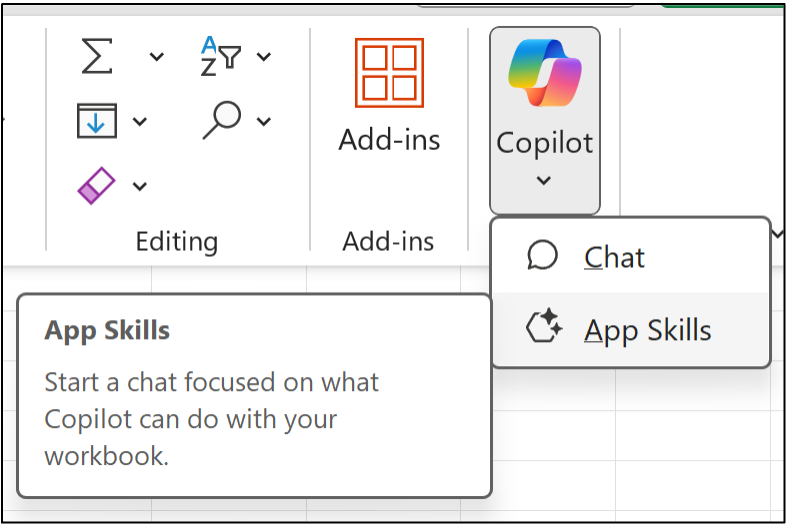
Just in case you're unfamiliar, the App Skills mode allows Copilot to directly interact with your Excel workbook. To be honest, I've tested Copilot in Excel's Chat mode as well and almost never use it for my hands-on analytics work.
In response, Excel opens the Copilot chat pane and informs you that you need to turn on the AutoSave feature:
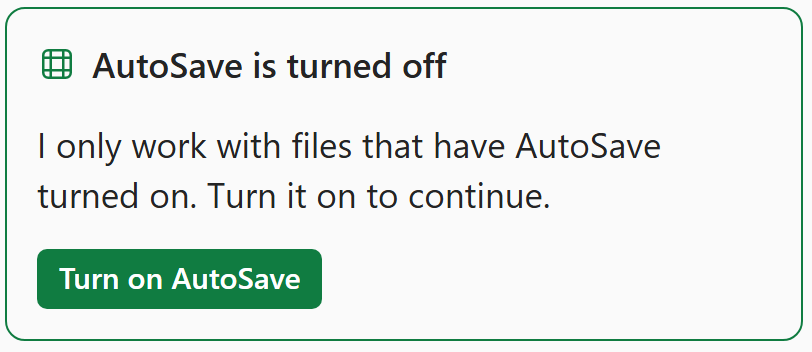
At the time of this writing, it's required that you store your Excel workbook in Microsoft's cloud (i.e., using AutoSave) to truly unleash the power of Copilot in Excel.
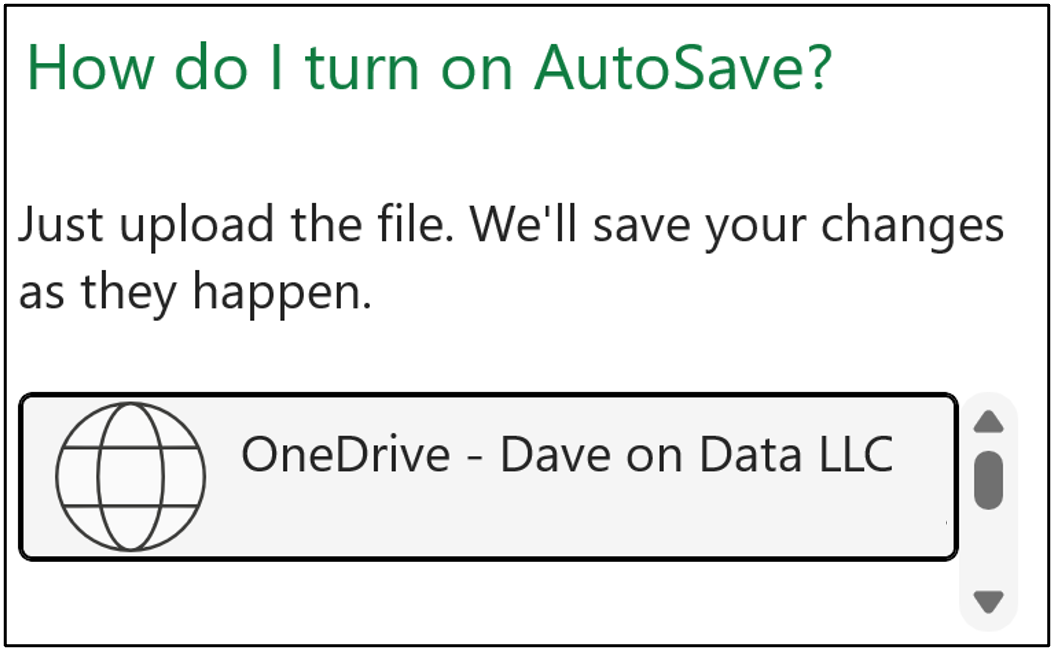
You will see a dialog like the following pop up. If you're using a work computer, be sure to check with your IT department as to where you should save your workbooks. I save mine to my company's OneDrive:
Once the workbook has been saved in Microsoft's cloud, the Copilot pane in Excel will show you some pre-generated prompts:
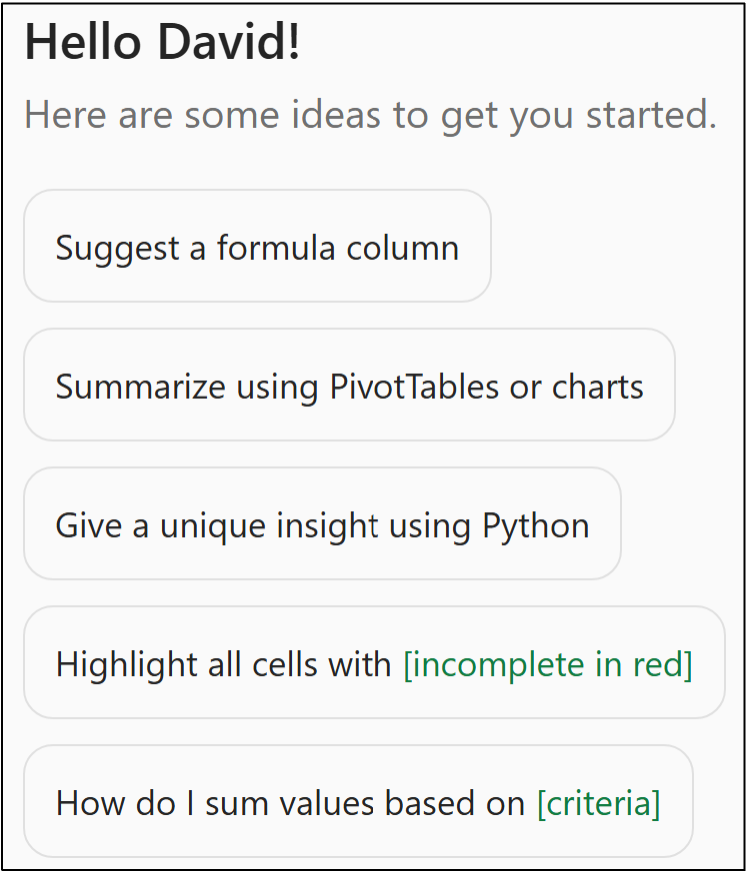
While you can certainly experiment with these prompts, I've never found them useful for any real-world analytics work. Instead, this is the first prompt I give Copilot in Excel 90% of the time:
Please start advanced analysis mode.
After you give Copilot in Excel the above prompt, it responds with the following:
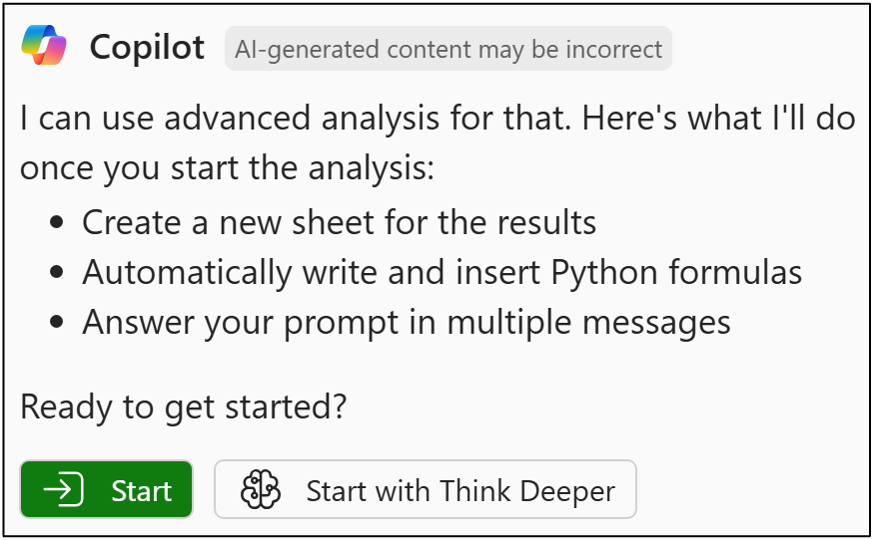
For right now, ignore Start with Think Deeper. I will cover this Copilot in Excel mode in a later tutorial series. Instead, click the Start button.
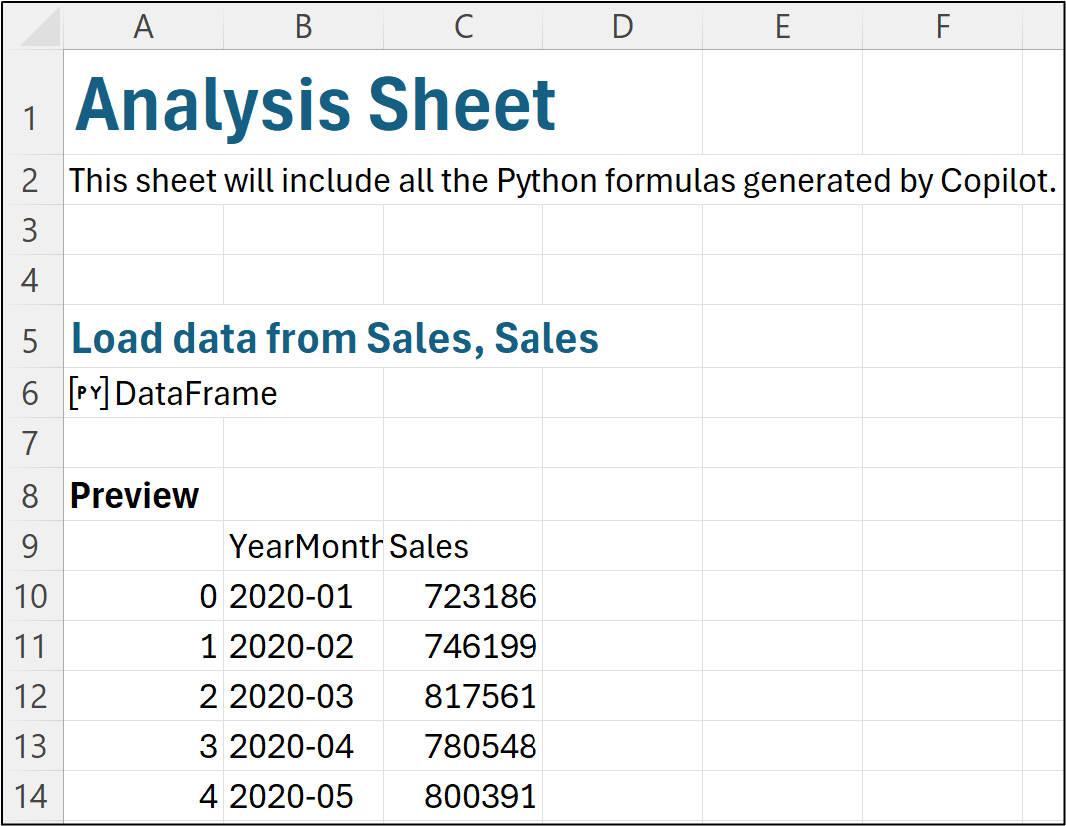
In response, Copilot in Excel will create a new worksheet in the workbook where it will store all of the Python in Excel code it generates in response to your prompts:
At this point, I need to mention a critical idea for using Copilot in Excel. This idea, by the way, applies to any AI tool you might use (e.g., ChatGPT):
There is no guarantee that you will see exactly the same thing in your workbook as you see in this tutorial - even if you use the exact same prompts. This is not a bug. This is the reality of today's AI tools.
For many professionals, this idea is a bit disconcerting at first, but here's how you mitigate it in the real world:
Using very detailed prompts can significantly reduce the randomness in Copilot in Excel's output.
Using Copilot in Excel to generate reproducible outputs (e.g., Python in Excel code) gives you far more control over your analytics.
For example, Copilot in Excel generated Python code to load the Sales table as a pandas DataFrame. Here's how you can look at the reproducible code by accessing Formulas in the Ribbon:
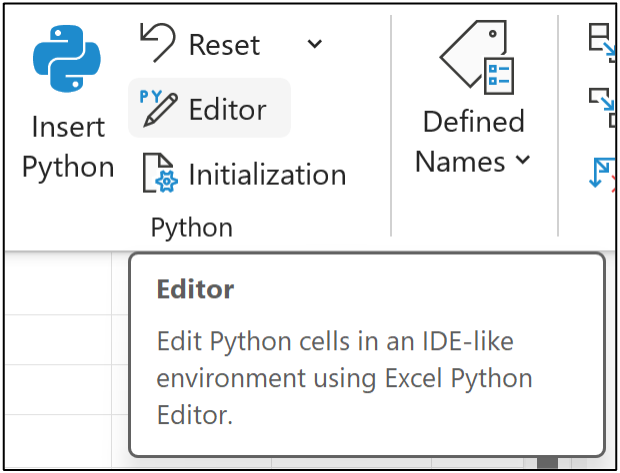
This opens Excel's new Python Editor, where you can see the code Copilot in Excel inserted into cell A6 of the worksheet:
You can switch between the Python Editor and Copilot in Excel using the following icons in the right-hand pane:
With the workbook prepped, it's time to partner with Copilot in Excel to build an ARIMA forecasting model.
Preparing the Data
As you've learned in previous tutorials in this series, it's best if you prepare the data for use with the mighty statsmodels library that's included with Python in Excel. Here's the prompt to prepare the data:
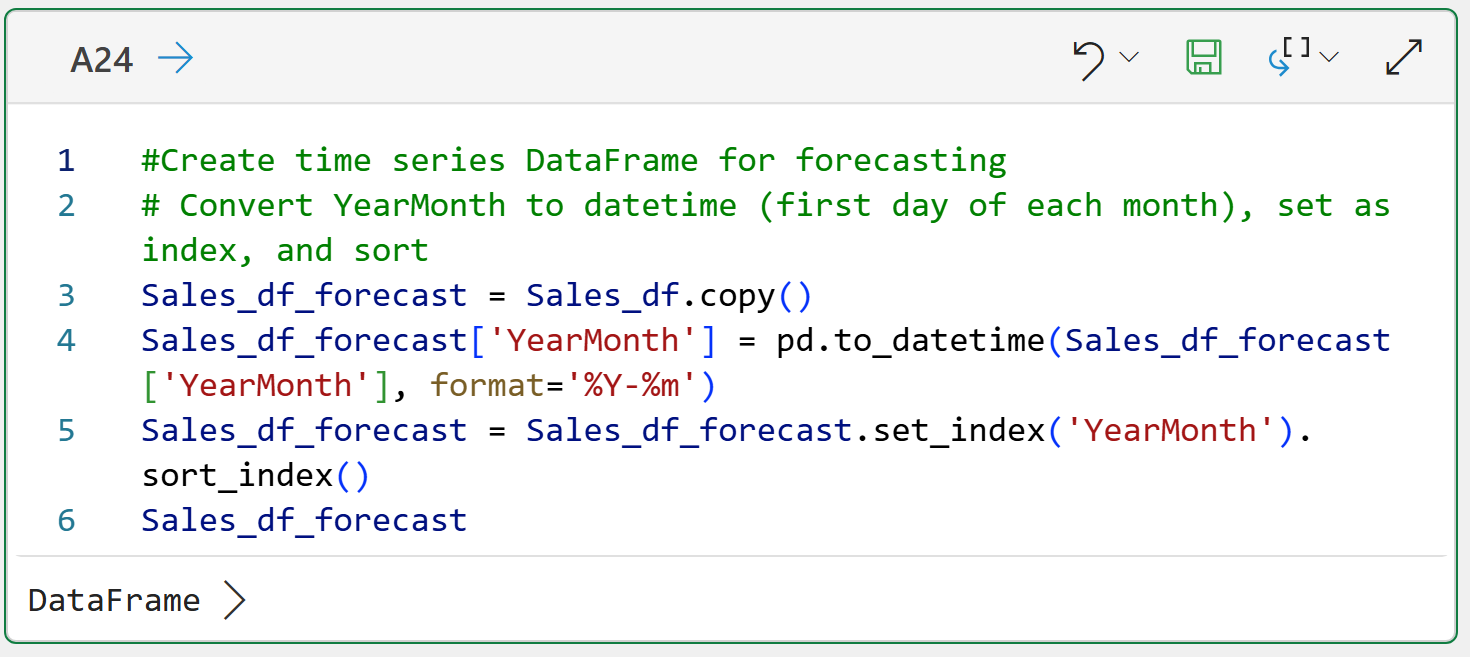
The table you loaded is a time series dataset. I would like to use this dataset to build a forecasting model, but I need to create a new DataFrame suitable for forecasting. Can you create a new DataFrame where you convert the YearMonth feature into a Datetime and then make YearMonth the index of the new DateFrame? Each date YearMonth represents the first day of each month. Lastly, please sort the new DateFrame in ascending order by the index.
Here's the code Copilot in Excel generated for me in response to the prompt above. Remember, your code might not look exactly like this:
As a former software engineer and hands-on analytics consultant, I'm typically not wild about the code that Copilot in Excel generates.
However, in real-world business analytics, the code is usually "good enough" to get results to business stakeholders fast (i.e., what they really care about).
In addition to speed, business stakeholders want analytics they can trust to inform better decisions. So, this brings up another critical idea when using Copilot in Excel:
You must trust, but verify, what Copilot produces.
As the tutorial moves on, you will see that to do this, you must have both Python and analytics skills.
Next up, as you learned in previous tutorials in this series, you need to create external factors (i.e., exogenous variables) to help the ARIMA model learn about seasonality:
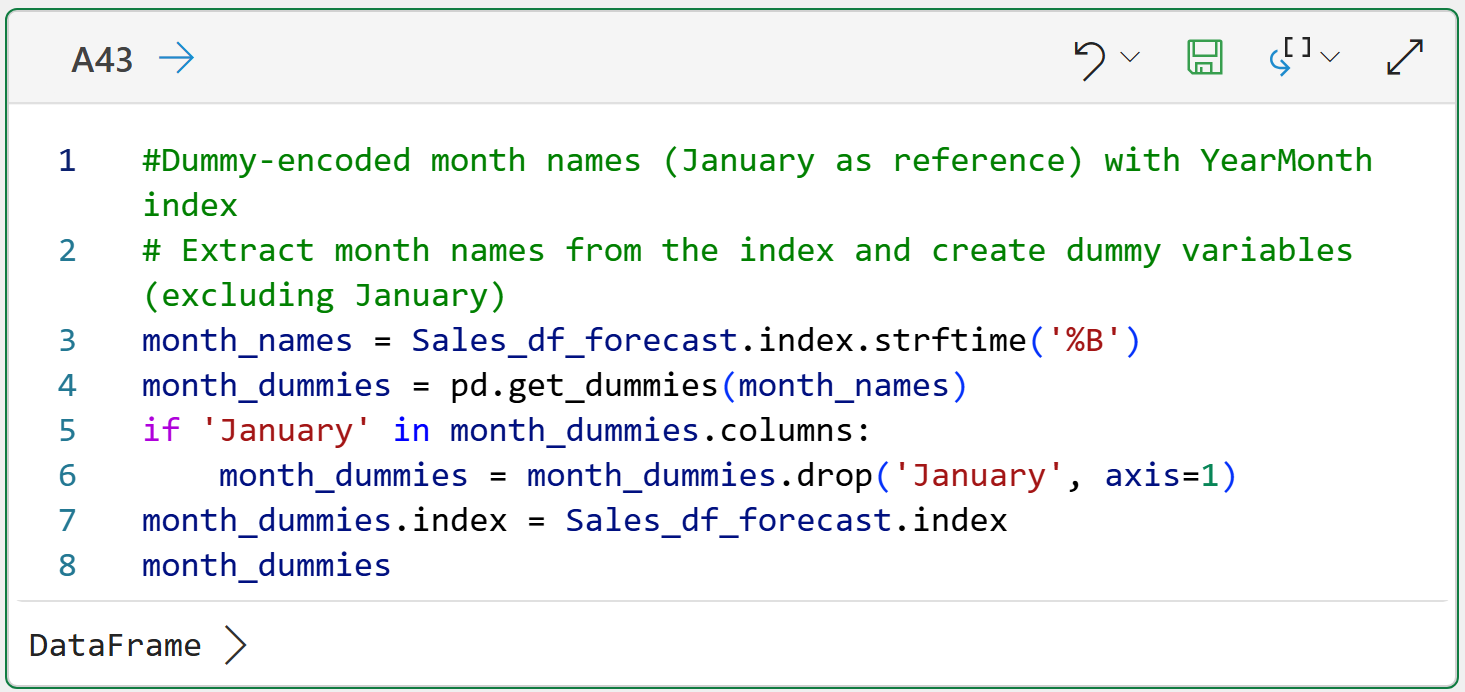
I would like to use exogenous features in my forecasting model. Can you create a new DataFrame that is the dummy-encoded month name for each row of data? Extract the month names from the YearMonth index and please use January as the reference for the dummy encoding (i.e., do not include January in the DataFrame, but include all other months). Lastly, make the index of this new DataFrame the YearMonth index from the source DataFrame.
Here's the Python in Excel code that Copilot generated for me in response to this prompt:
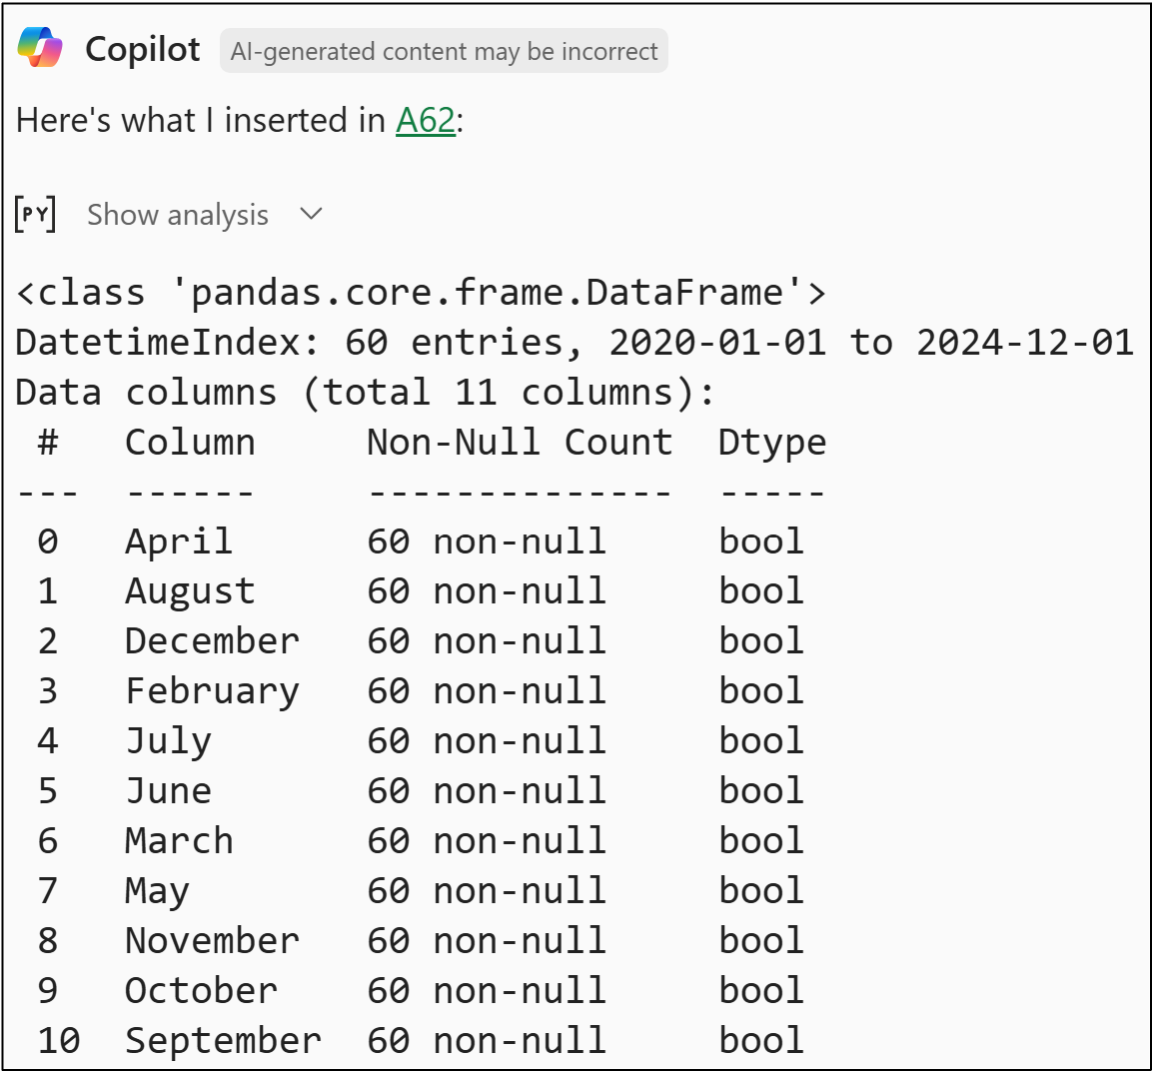
Again, I don't love this code, but I verified that it works as specified in my prompt by asking Copilot in Excel to do this:
Please call info() on the exogenous features DataFrame.
Here's the prompt's output:
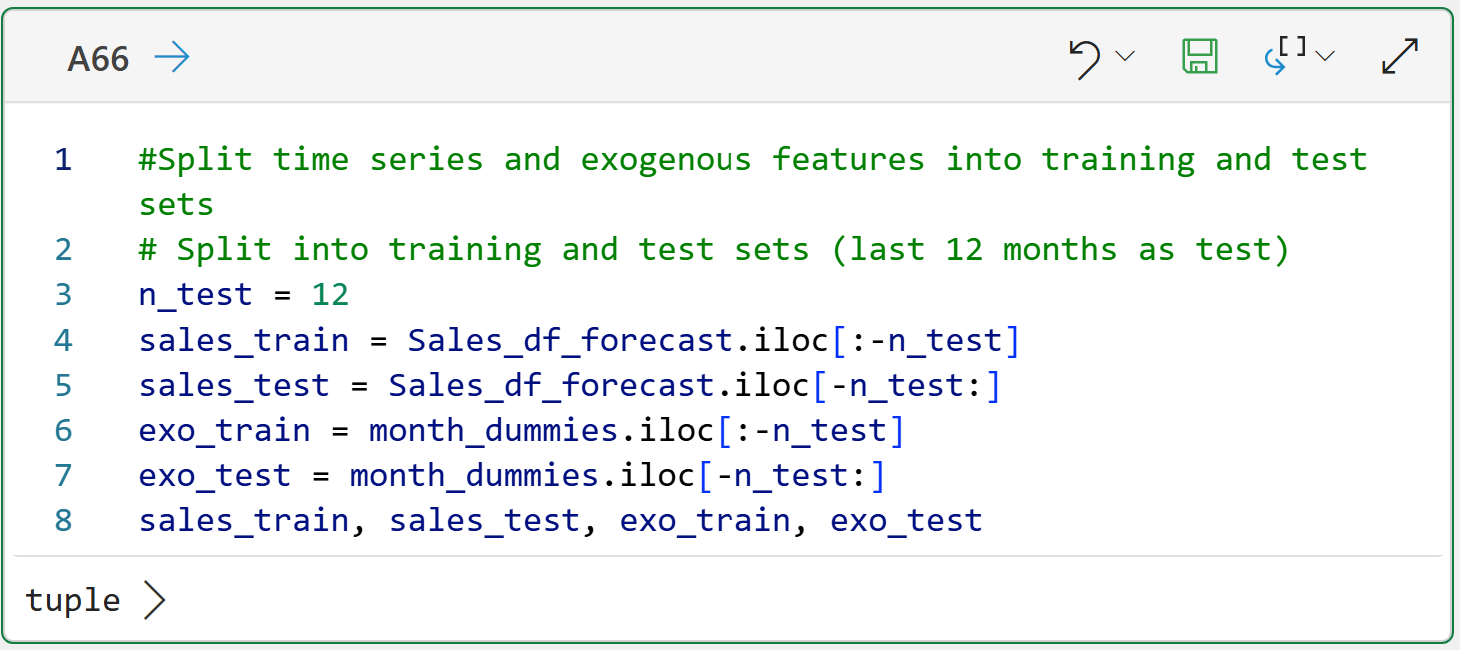
Lastly, as you learned previously, the data needs to be split into separate training and test datasets:
I need to split the time series and exogenous features DataFrames into a training and test datasets. Please split the data so that the last year of data is the test dataset and all the previous data is the training dataset.
And the code Copilot in Excel generated for this prompt:
Not to sound like a broken record, but I don't love this code. However, it does work as specified by my prompt.
BTW - If you're new to Python in Excel, check out my book Python in Excel Step-by-Step. I wrote it specifically for professionals who have never used a programming language before.
With the data prepared, it's time to build the ARIMA forecasting model.
Building the Model
When you understand the "why" behind analytics, writing prompts to do magical things isn't very difficult. Here's a prompt for building an ARIMA model optimized for the training data, including the exogenous features:
I want to build an ARIMA forecasting model for optimal predictive performance based on mean absolute error (MAE) using the training time series and exogenous features DataFrames. Please use a grid search to find the optimal values of p, d, and q and report back to me the order of the best model along with the model’s MAE.
Here's the output that Copilot in Excel gave me in response to this latest prompt:
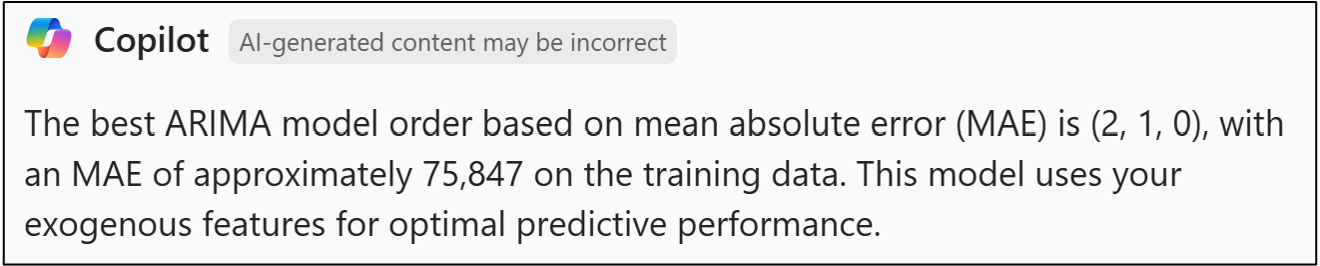
This result is better than what you saw in Part 7 of this tutorial series. Once again, trust but verify is the name of the AI game:
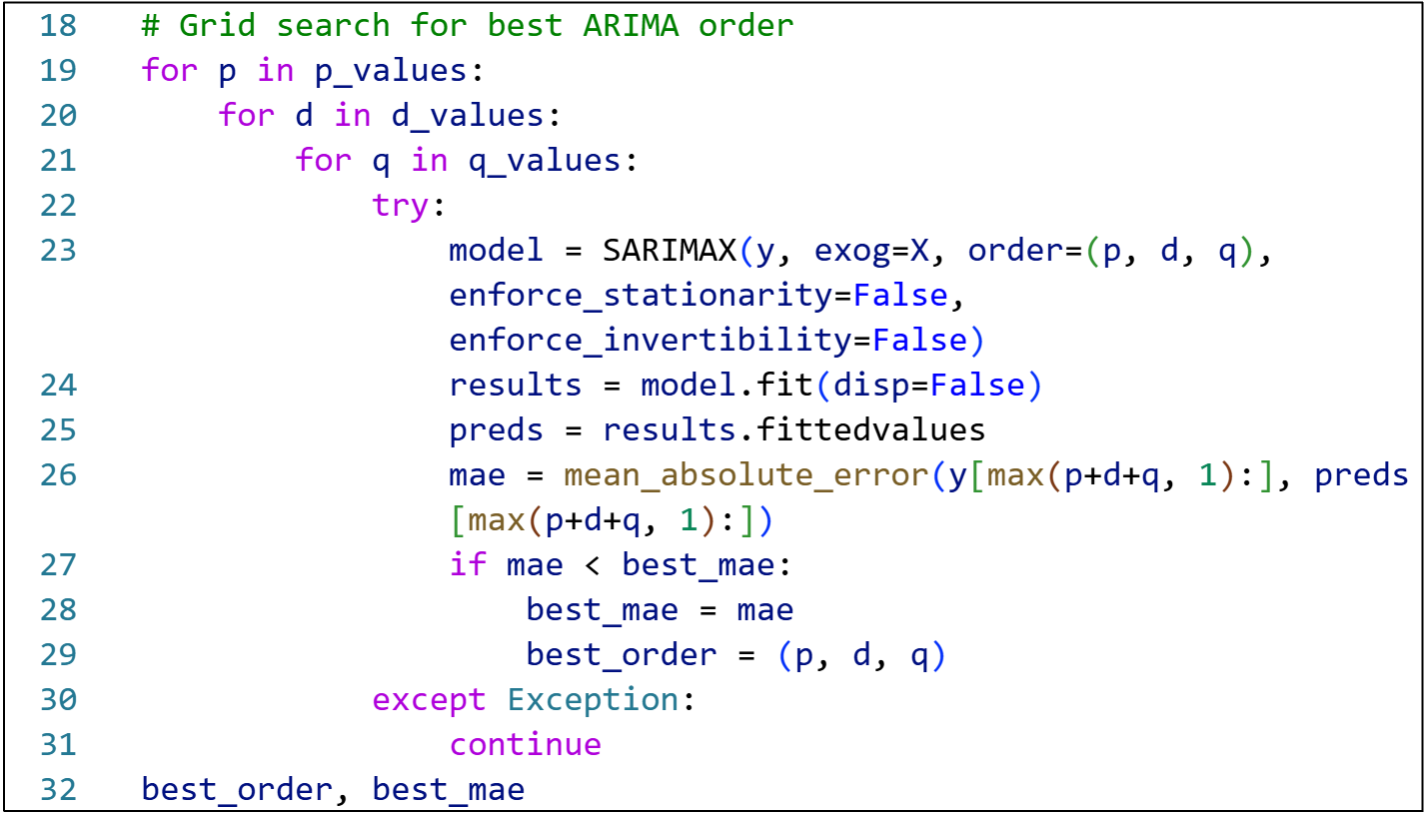
The code is a snippet of what Copilot in Excel generated for finding an optimal ARIMA model. Line 23 of the code shows that Copilot in Excel overrode the default values for the enforce_stationarity and enforce_invertibility parameters.
It never hurts to ask Copilot in Excel why it did something:
In the grid search code, why did you set the enforce_stationarity and enforce_invertibility parameters to False?
Copilot in Excel responded with:

Fair enough. If you don't like Copilot in Excel's response, you can always re-prompt it to perform the grid search without changing the parameter values.
Now it's time to see if the model is actually any good.
Testing the Model
A simple prompt tells Copilot in Excel what needs to be done:
Using the optimal ARIMA model order you found, make forecasts for the test dataset, calculate MAE for the test dataset, and report the results.
And the code Copilot in Excel generated:
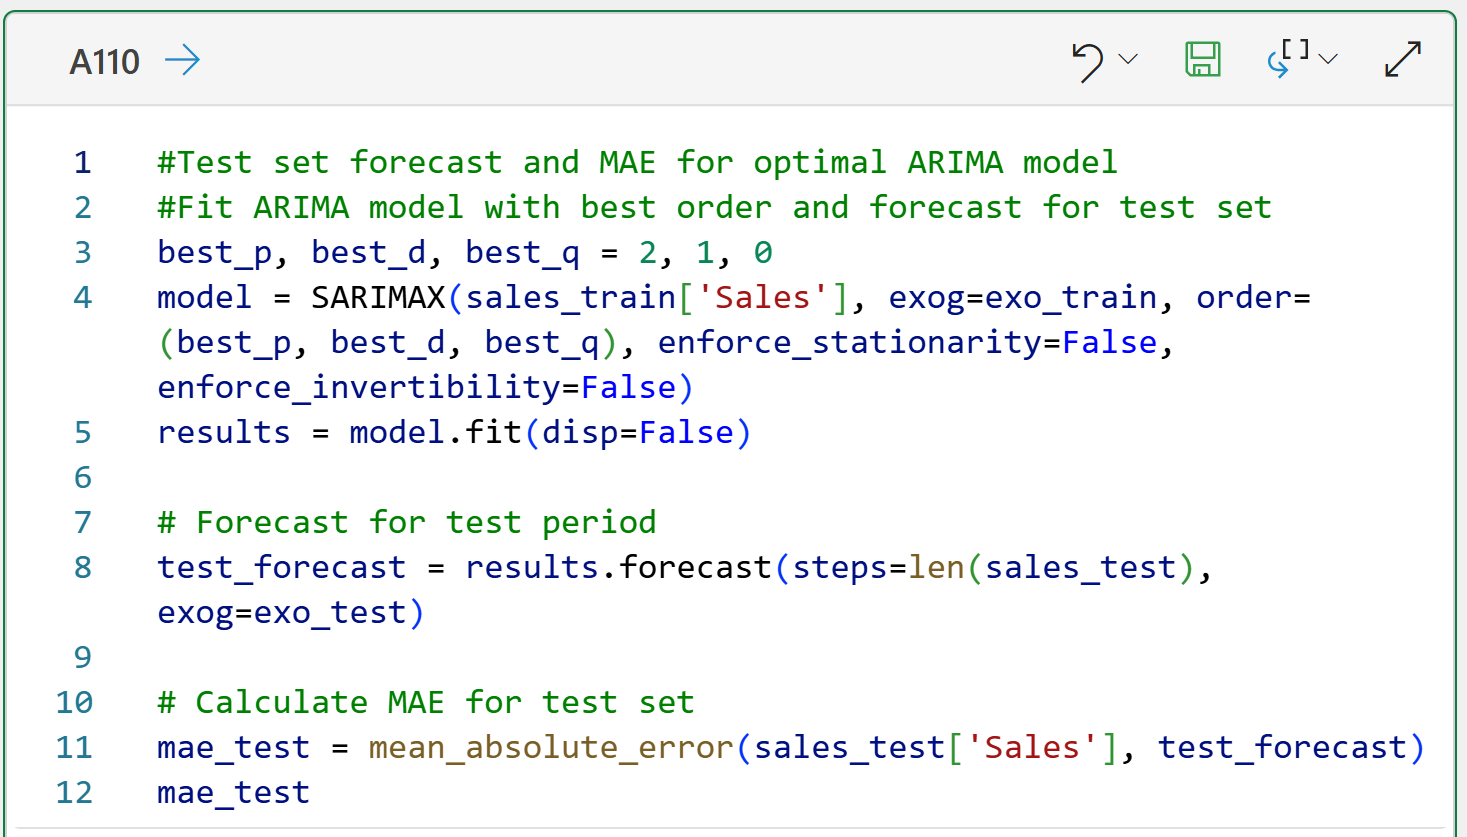
And the results:
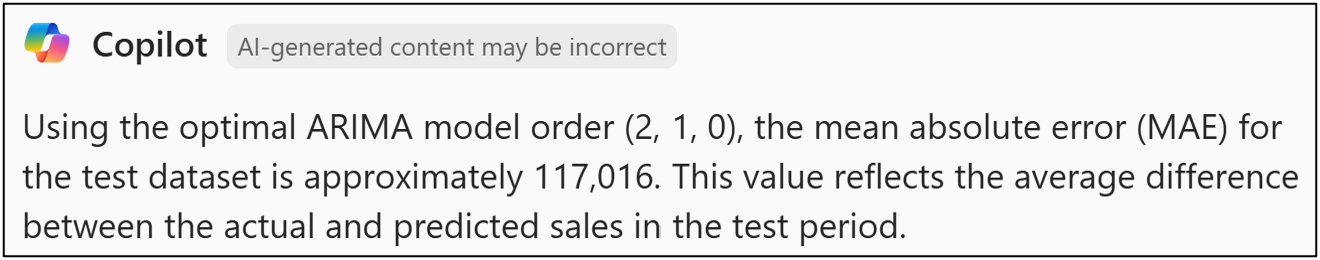
If you compare the above results to what you saw in Part 7, the Copilot in the Excel-generated model performs worse (i.e., the model overfits to the training data).
If you're interested in building the best possible model, you can always give it another try using the MarketingSpend exogenous feature in the SalesAndMarketing table. Changing the prompts will be easy.
This Week’s Book
I was asked once again about using Generative AI to accelerate do-it-yourself (DIY) data science work. Not surprisingly, my response was that the first step is to build the requisite skills (otherwise, how would you recognize hallucinations?) The second step is to learn how to prompt the LLM (e.g., Copilot in Excel) effectively:

This book offers an interesting take on engineering your LLM prompts. It will show you how to build and submit your prompts using Python code.
I see this as overkill, to be honest. However, the book also covers prompting strategies regardless of how you interact with the LLM (e.g., I use Copilot in Excel instead of Python code).
That's it for this week.
Next week's newsletter will start a new tutorial series on mining free-form text using Python in Excel.
Stay healthy and happy data sleuthing!

Dave Langer
Whenever you're ready, here are 3 ways I can help you:
1 - The future of Microsoft Excel forecasting is unleashing the power of machine learning using Python in Excel. Do you want to be part of the future? Order my book on Amazon.
2 - Are you new to data analysis? My Visual Analysis with Python online course will teach you the fundamentals you need - fast. No complex math required, and Copilot in Excel AI prompts are included!
3 - Cluster Analysis with Python: Most of the world's data is unlabeled and can't be used for predictive models. This is where my self-paced online course teaches you how to extract insights from your unlabeled data. Copilot in Excel AI prompts are included!