
Join 1,000s of professionals who are building real-world skills for better forecasts with Microsoft Excel.
Issue #45 - Forecasting with Excel Part 8:
AI Prompts
This Week’s Tutorial
This week's tutorial will demonstrate how your forecasting skills enable you to leverage the Copilot in Excel AI to build more accurate forecasts, and concludes this 8-part tutorial series.
It shouldn't surprise you to know that my clients regularly ask me about AI because their leaders suffer from AI FOMO. I always tell my clients the same thing.
Copilot in Excel is the ideal platform for organizations to deploy AI, as Excel is widely used throughout organizations. And Copilot in Excel is specifically designed to assist professionals in working with data.
It's a win-win for organizations that are under pressure "to show value from AI."
This tutorial will demonstrate how, in the hands of skilled professionals, AI can simultaneously increase productivity and improve business outcomes though better forecasting.
If you would like to follow along with today's tutorial (highly recommended), you will need to download the SalesTimeSeries.xlsx file from the newsletter's GitHub repository.
Also, you can check out the previous tutorials in this series if you need to catch up or refresh your knowledge.
A Quick Note About FORECAST.ETS()
As covered in a previous tutorial in this series, Excel's FORECAST.ETS() function is arguably the premier way to build better forecasts using native Excel functionality.
I spent more than an hour prompting Copilot in Excel's "App Skills" mode to produce forecasts using this function, but to no avail.
To be honest, this outcome didn't surprise me at all.
What is now called "App Skills" is Copilot in Excel's default AI mode, and I've always found that its uses are focused on everyday Excel tasks like:
Generating Excel formulas
Generating PivotTables
Conditional formatting
I've also always found "App Skills" mode to be a non-starter for any form of more advanced analytics (e.g., forecasting).
Microsoft is actively working on a feature called "Agent Mode" for Copilot, which should (hopefully) improve this situation.
Due to the current Copilot limitations, this tutorial will focus on the best way to leverage AI in an Excel workbook, specifically Copilot in Excel's "Advanced Analysis" mode.
Preparing the Workbook
At the time of this writing, an Excel workbook must be saved in Microsoft's cloud in order to use Copilot. This can be accomplished by toggling the workbook to use AutoSave:

With AutoSave turned on, Excel will ask you where you want to save the workbook in Microsoft's cloud:
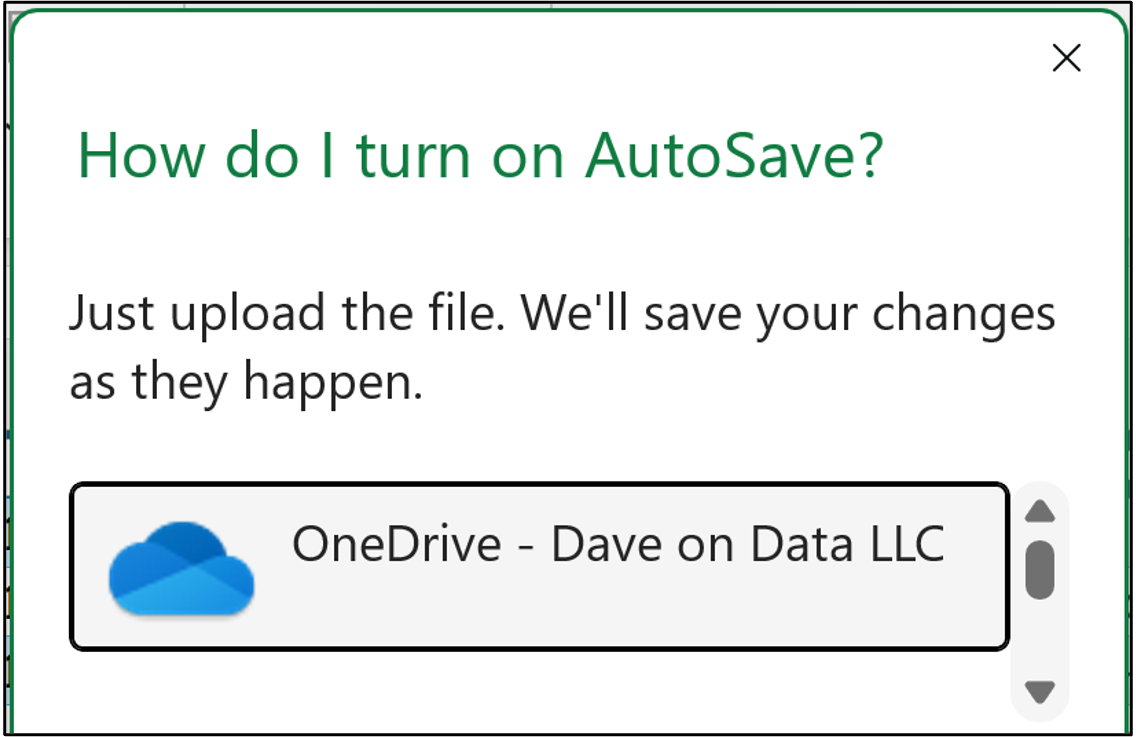
In the image above you can see that I've selected to use the OneDrive account associated with my business. However, there are multiple alternatives available:
If you're using your personal laptop, OneDrive is a good choice.
If you're using a work laptop, check with your IT department.
It's usually a good idea to close Excel and then reopen the workbook from the cloud location.
For this tutorial, be sure you've clicked on a cell in the Sales table on the Sales worksheet. This tells Copilot which data in the workbook you want to use.
With the cloud workbook reopened, it's time to fire up Copilot:
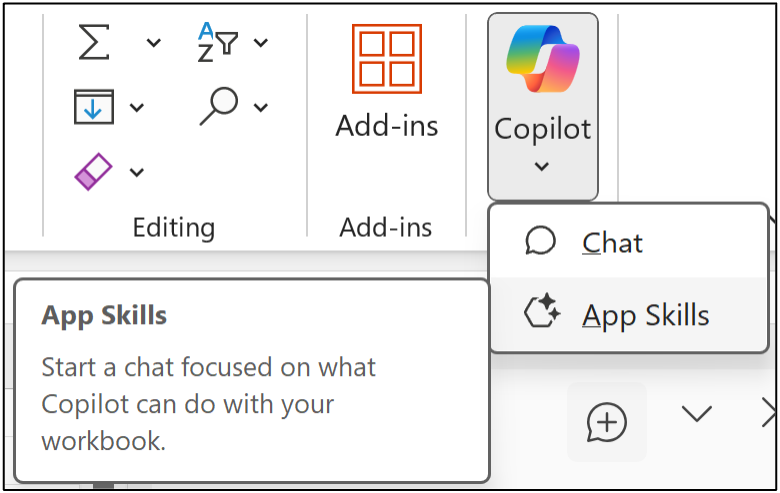
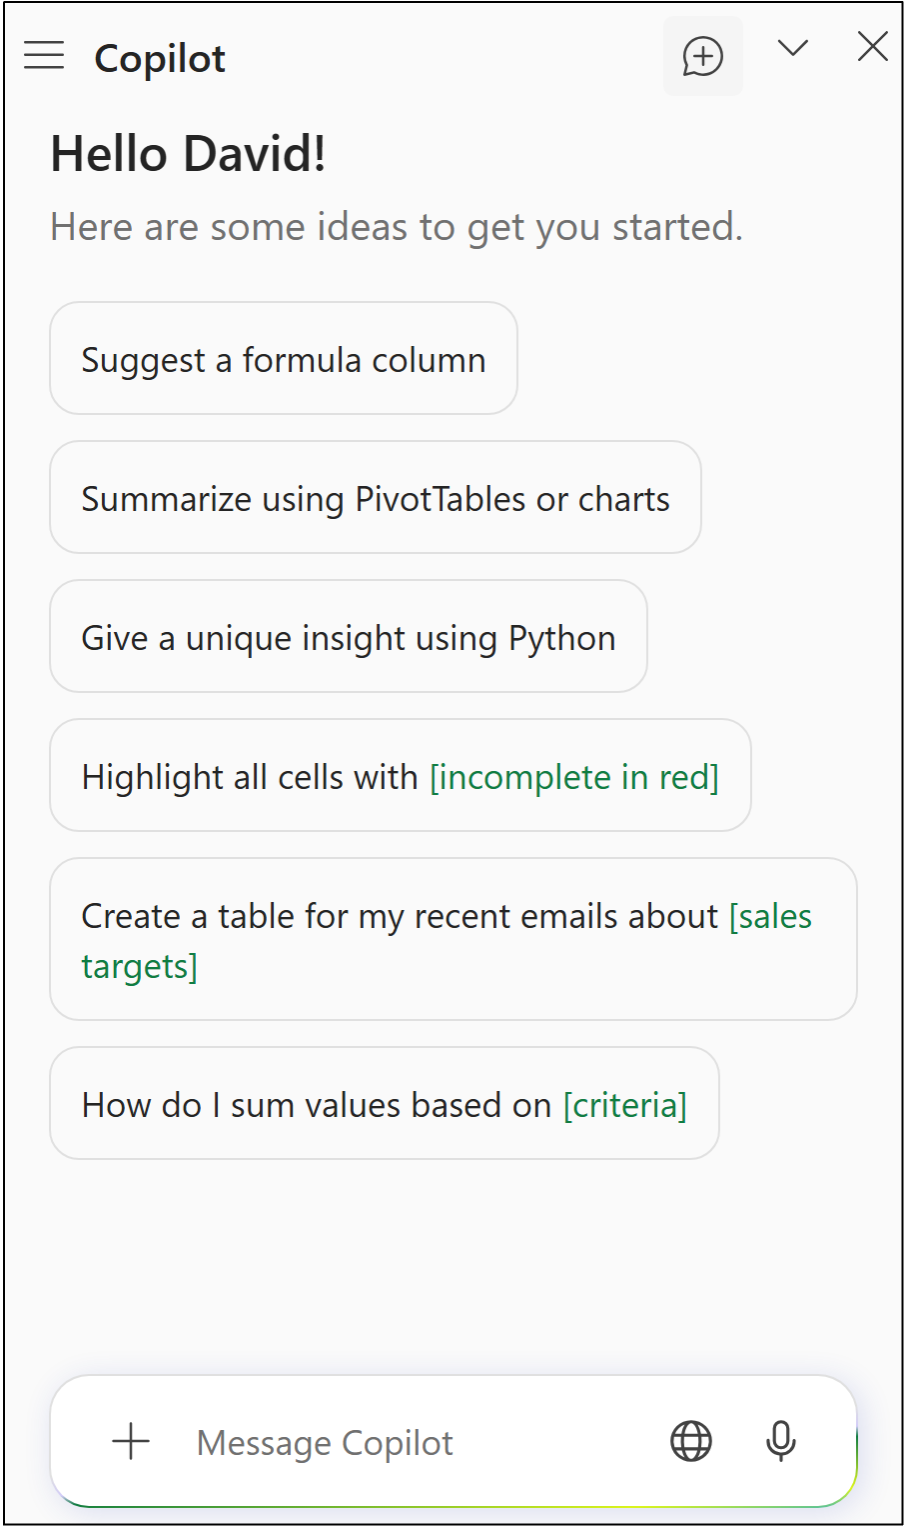
Selecting App Skills will open the Copilot pane where you enter your prompts to work with Copilot:
Enter the following prompt to start Copilot's Advanced Analysis mode:
Please start advanced analysis.
At the time of this writing, you have to explicitly tell Copilot to start Advanced Analysis mode by clicking Start:
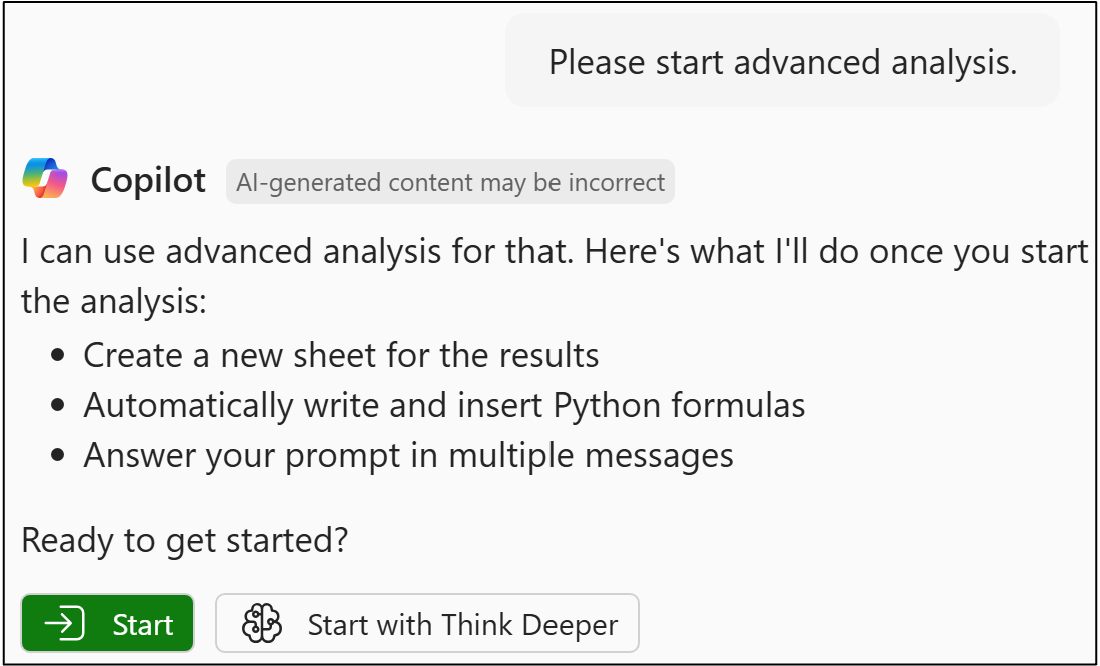
After clicking Start, Copilot will add a new worksheet to your workbook where it will store the Python in Excel code that it generates.
In my testing, you will see Copilot do one of two things:
Copilot only loads the Sales table into Python and stops.
Copilot loads the Sales table into Python and automatically runs some preliminary analyses.
There is a certain level of randomness regarding which of the above you will see. This is a direct result of working with the current generation of AI tools.
In other words, if you see something different, it could be the AI.
This is why developing analytical skills is crucial for effectively using Copilot in Excel - you will know how to write prompts that consistently produce the results you need.
Preparing the Data
As covered in previous tutorials in this series, when building forecasting models with Python, it's a good idea to set the DataFrame index to be the timestamp of your time series. The following prompt will generate the code to do this:
The Sales table contains time-series data, where each row represents a single month. Please create a DataFrame where the index is built from YearMonth column. This column should be transformed into a DateTime before being made the index with a frequency of the first day of the month.
In response to the above prompt, Copilot will generate a new Python in Excel formula to set up the DataFrame. You will see something like the following in the worksheet as a result:
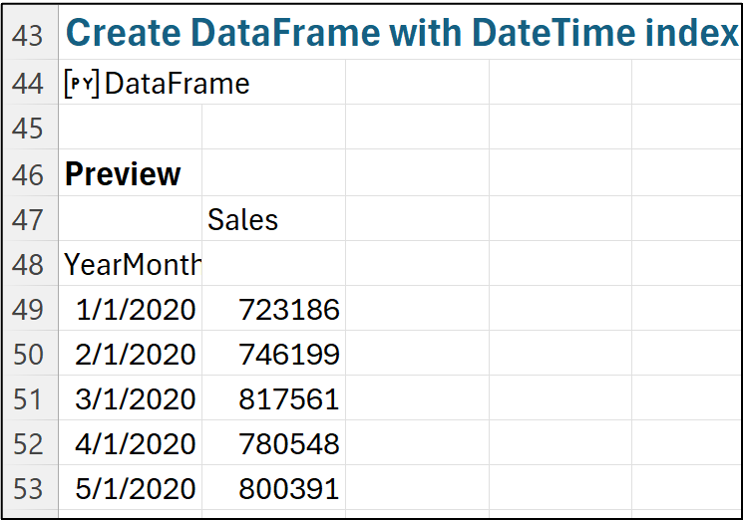
As shown in the image above, the Python code that Copilot generated is stored in cell A44.
NOTE - Your code might be in a different cell depending on whether Copilot performed some analyses on its own or not.
You can check out the code by opening the Python Editor from the Formulas section of the Ribbon:
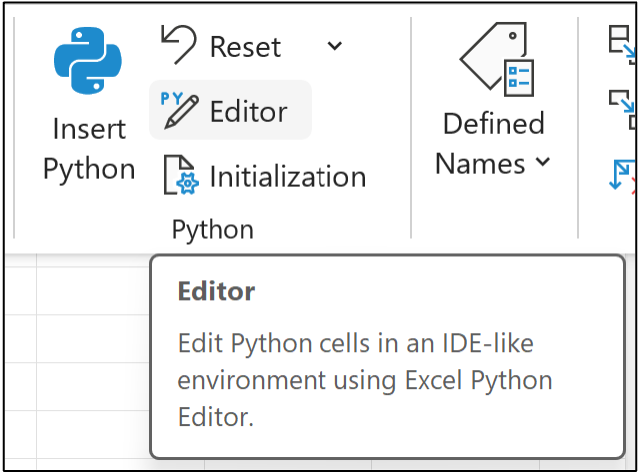
The Python Editor pane will open in response and you can scroll down the code cells until you reach cell A44:
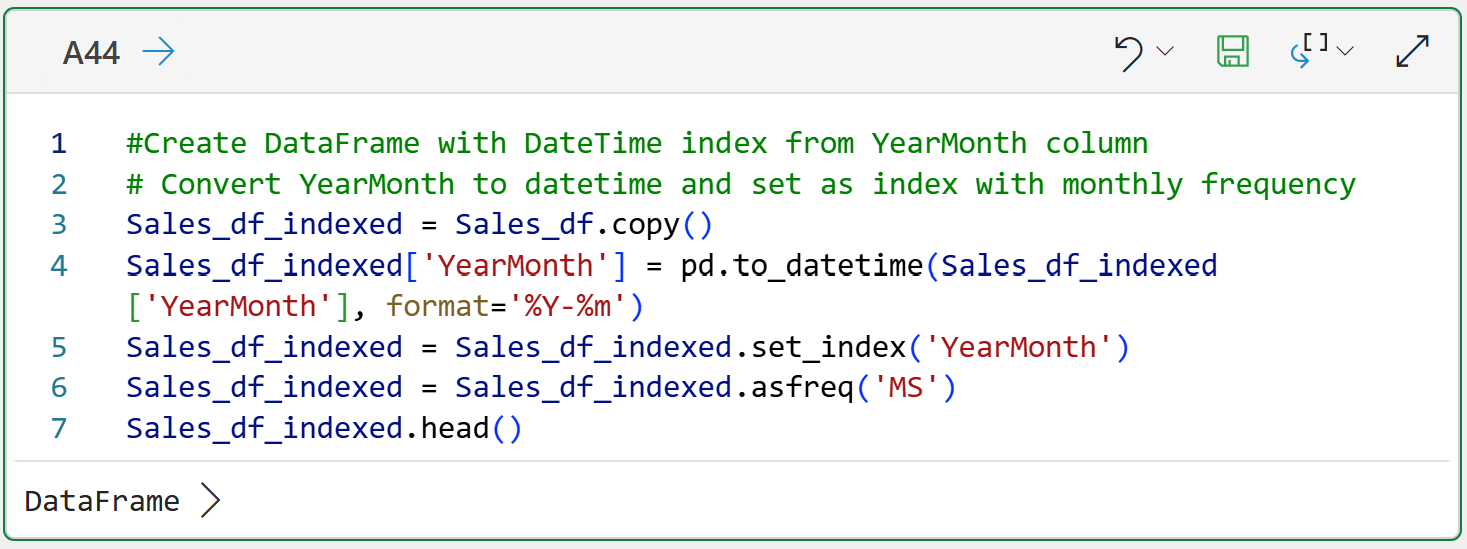
The above code demonstrates three critical ideas for using Copilot in Excel effectively.
First, Copilot in Excel often uses Python to work magic with your data. Copilot certainly does this in Advanced Analysis mode, but my testing also shows that the Copilot's Chat mode will also default to using Python for most analytics tasks. I'm betting that when Copilot's new Agent Mode goes live it will also default to using Python for most analytics tasks.
Second, think of Copilot in Excel as a junior-level coder. So, Copilot will often generate code that is not elegant and/or inefficient. Copilot can also generate code that is incorrect.
Third, because of this, top Microsoft Excel users will develop the Python analytics skills to most effectively partner with Copilot in Excel - including verifying what Copilot produces.
As covered earlier in this tutorial series, the last step in preparing the data is to split it into training and testing datasets. Here's the prompt:
I need to develop and test forecasting models to identify the optimal model for my data. The first four years of data should be used to train the models, and the last year of data should be used for testing. Please split the data accordingly.
In my testing, the above prompt typically generates a number of Python formulas that split the data and provide some previews of the split data. Your experience may vary from mine and that's par for the course when using AI.
Here's the code Copilot generated in my workbook in response to the above prompt:
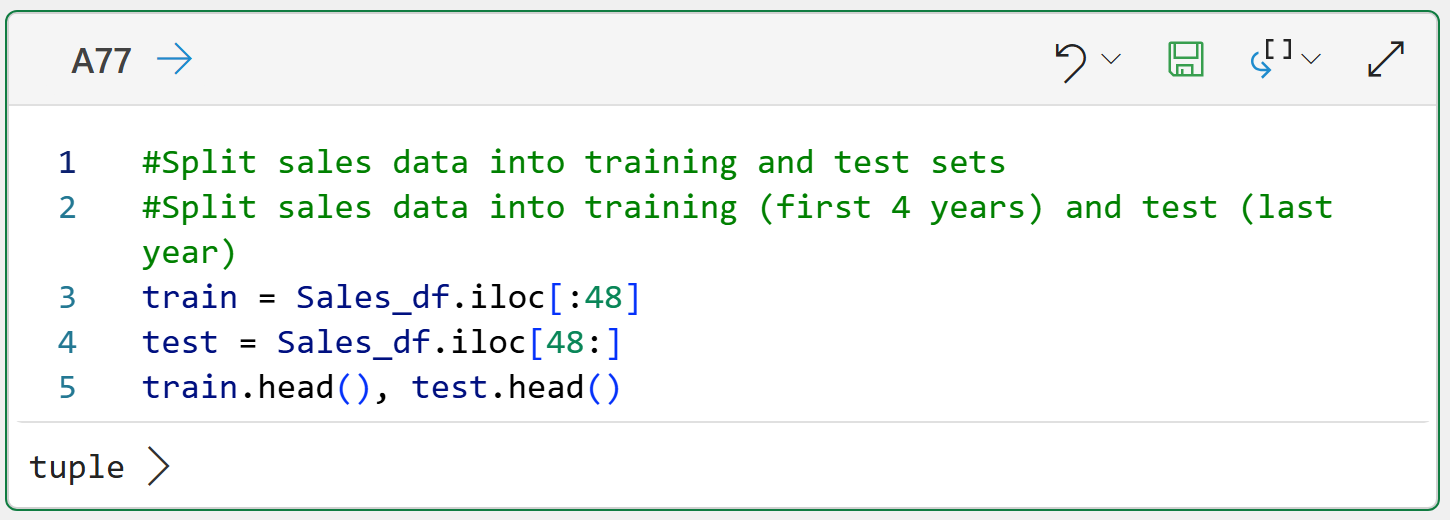
I will freely admit this isn't the way I would have wrote the Python code to split the data, but it does get the job done. Once again, the name of the game using Copilot in Excel is "trust but verify."
With the data split, it's time to partner with Copilot in Excel to build some forecasting models.
Exponential Triple Smoothing Models
As discussed in a previous tutorial, the ETS in Excel's FORECAST.ETS() function name stands for exponential triple smoothing. ETS is a battle-tested technique for building data-driven forecasts, and Python in Excel provides you the ability to craft ETS forecasting models.
Here's the best part.
Python in Excel provides you with more flexibility in crafting ETS models compared to using FORECAST.ETS(). This means you can build better ETS forecasting models than what is possible with native Excel.
The following prompt asks Copilot to experiment with various ETS models to find the best for the Sales time series dataset:
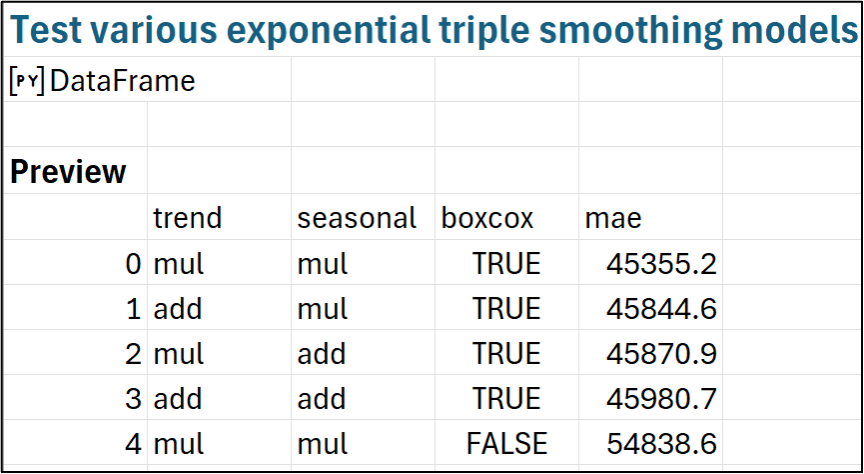
Please test various forms of exponential triple smoothing, including combinations of additive and multiplicative models. Also, explore using Box-Cox transformations using the constructor parameter of the ExponentialSmoothing class. The optimal model will score the lowest mean absolute error (MAE) on the test data. Report back on the top 5 models based on MAE with the test data.
In my testing, the above prompt typically generates a single Python formula to do the work of trying out the various ETS models. However, you may see Copilot in Excel report back that it generated code that produced and error. Usually, Copilot will generate additional code to fix the error without any effort on your part.
Here's an example of the output you get when Copilot finishes generating the code successfully:
As always, you want to verify the code Copilot generated that produced the above results. Blindly trusting any AI output (especially in analytics) is a bad idea.
As shown in an early tutorial in this series, the top four ETS models (also known as Holt-Winters models) above provide better forecasts than what the FORECAST.ETS() function produces.
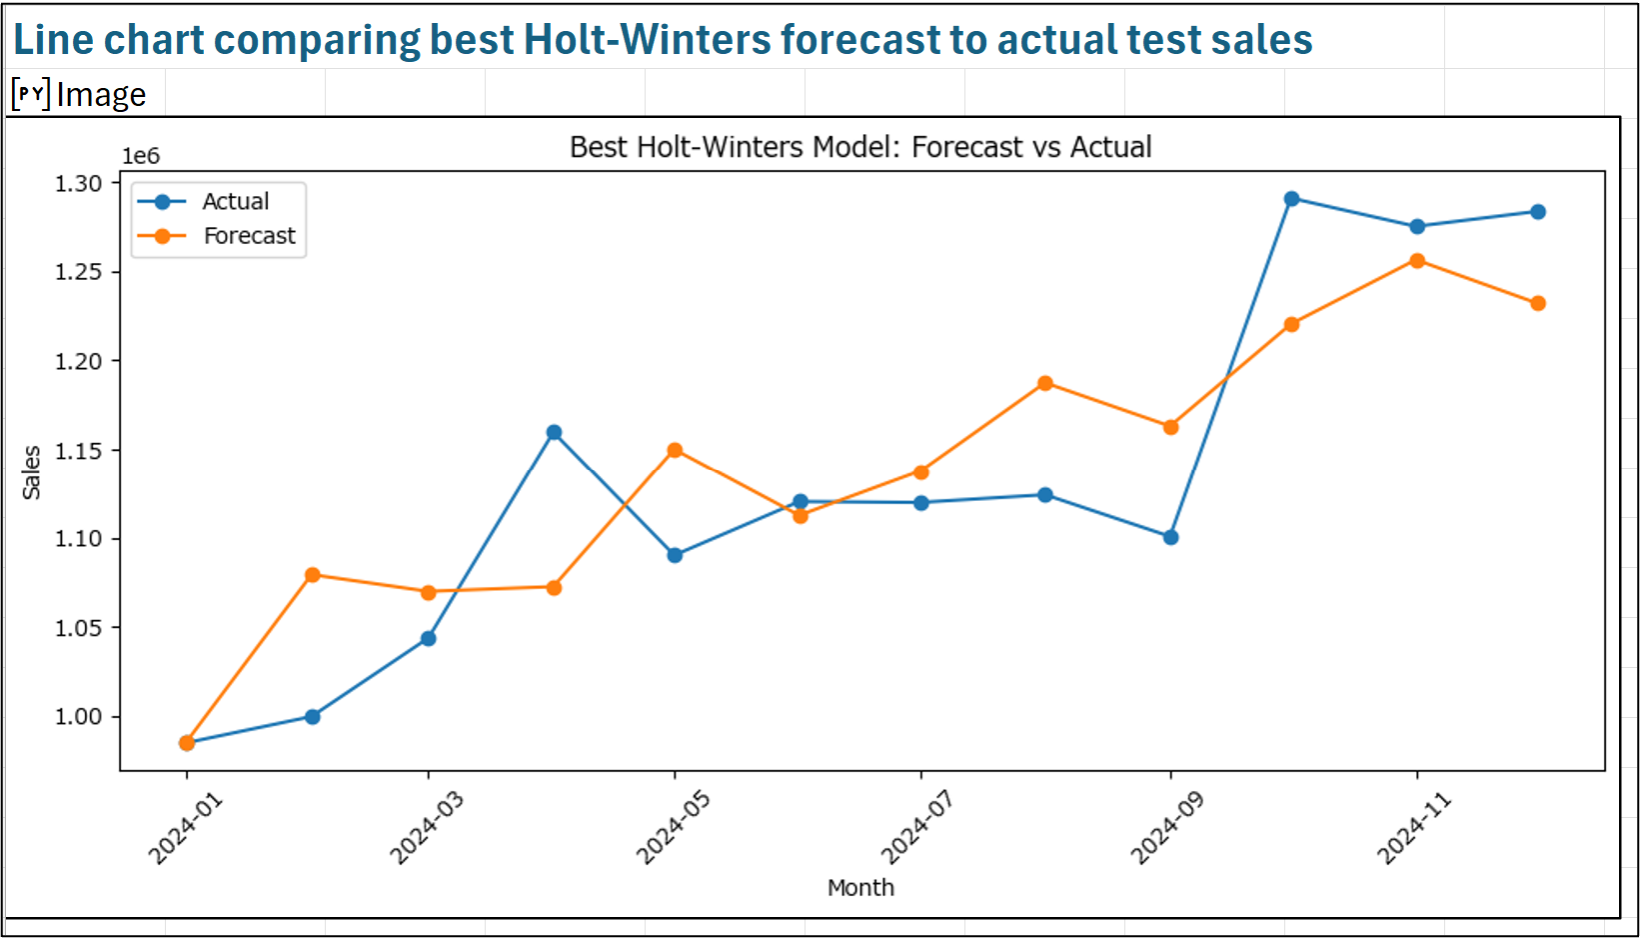
When working with time series forecasting, nothing beats a line chart for seeing what's going on with the forecasts. Here's a prompt to generate a line chart comparing the best ETS model's forecasts to the actual values:
Create a line chart that compares the forecasts of the best exponential triple smoothing model to the actual values from the test data.
And here's an example of the kind of output you can expect from Copilot:
Once again, as always, you should verify the code that Copilot in Excel generated matches the intent of your prompt.
Generally, the more specific your Copilot prompts are regarding what you want done, the better your results will be.
SARIMA Models
Python in Excel includes the mighty statsmodels library. Using statsmodels gives you access to many state-of-the-art forecasting techniques beyond exponential smoothing models.
For example, statsmodels provides various forms of autoregressive integrated moving average (ARIMA) models. ARIMA models, like ETS models, have been battle-tested over the years and are a powerful tool in your forecasting tool belt.
In addition to straight-up ARIMA models, the statsmodels library also provides the following extended versions of ARIMA:
SARIMA models for datasets with seasonality.
SARIMAX models for datasets with seasonality and exogenous variables (i.e., external drivers).
In case you're interested in learning more, I will be covering ARIMA models in my next tutorial series.
For this tutorial, we'll ask Copilot to test out SARIMA models for this dataset since we know from a previous tutorial in this series that:
The Sales dataset has seasonality.
The Sales dataset has no external drivers.
However, before testing out various SARIMA models to find one that is optimal for the Sales dataset, you will need to increase the Python in Excel timeout value.
By default, Python in Excel formulas will timeout after 30 seconds. This default is ridiculously low for real-world analytics work, so it's a good thing that changing it is quite easy. Here's how.
Within Excel, navigate to File -> Options -> Advanced and then scroll down to set the Python Formula Timeout:
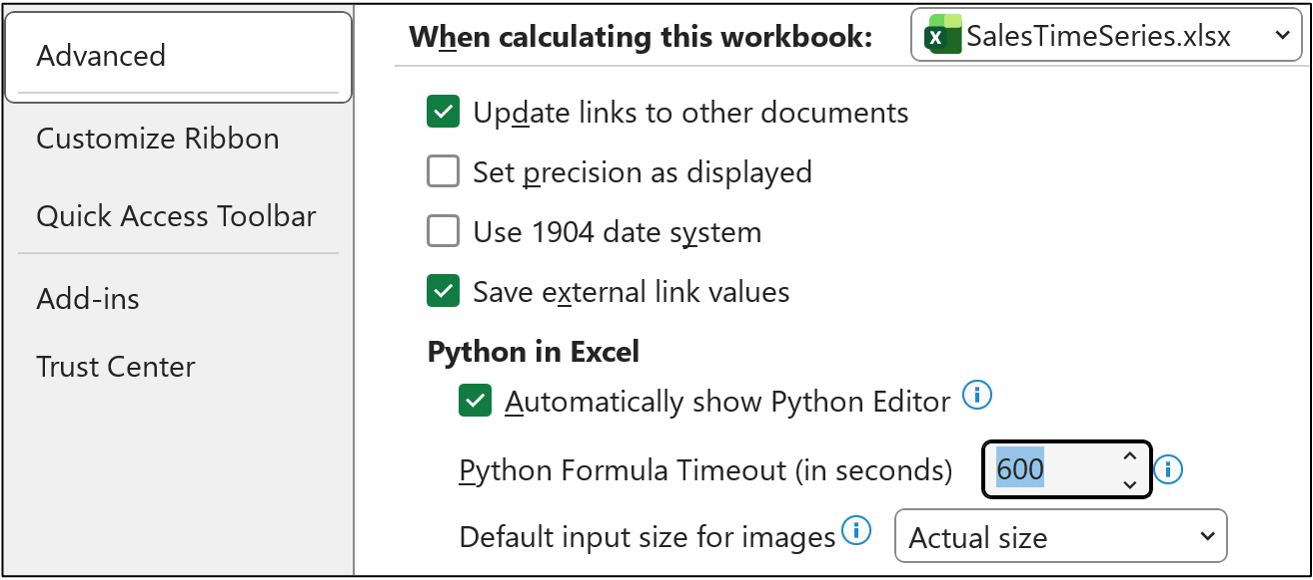
As shown in the image above, I typically set the timeout to be 600 seconds (i.e., 10 minutes). In my experience, this value is sufficient for most of my analytics work.
Click the OK button to set the timeout to the new value.
And here's the prompt to explore various SARIMA models to find that one that is optimal for the Sales dataset:
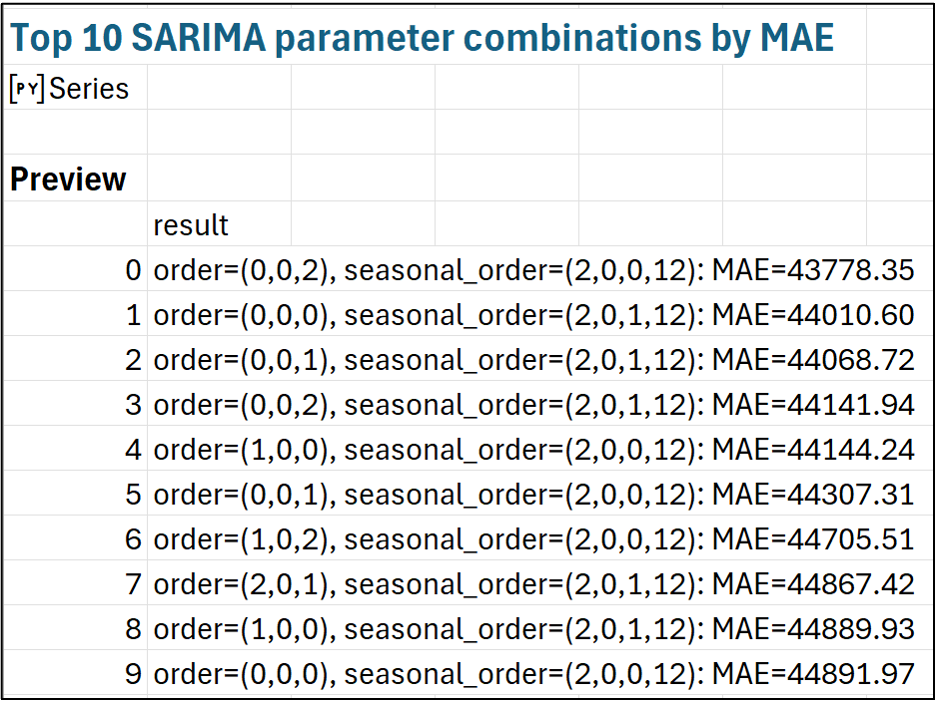
Now, test SARIMA models to find the optimal set of parameters, as measured by the MAE on the test data. The data's seasonality is annual, so keep that in mind. Try combinations of parameter values ranging from 0 to 2 and report back the MAE scores for the top 10 combinations as string values. Please display the MAE score along with the parameter values.
The Python code that Copilot will generate in response to this prompt will take a while to run because it is building and testing a large number of SARIMA models using different parameter combinations. Please be patient. 😁
Here's an example of the kind output that Copilot will generate due to the above prompt:
Per the usual, you will want to verify the Python code produced by Copilot in Excel.
Assuming that the code is OK, the above output shows that every one of the top 10 SARIMA models produce better forecasts than the forecasts provided by using Excel's FORECAST.ETS() function.
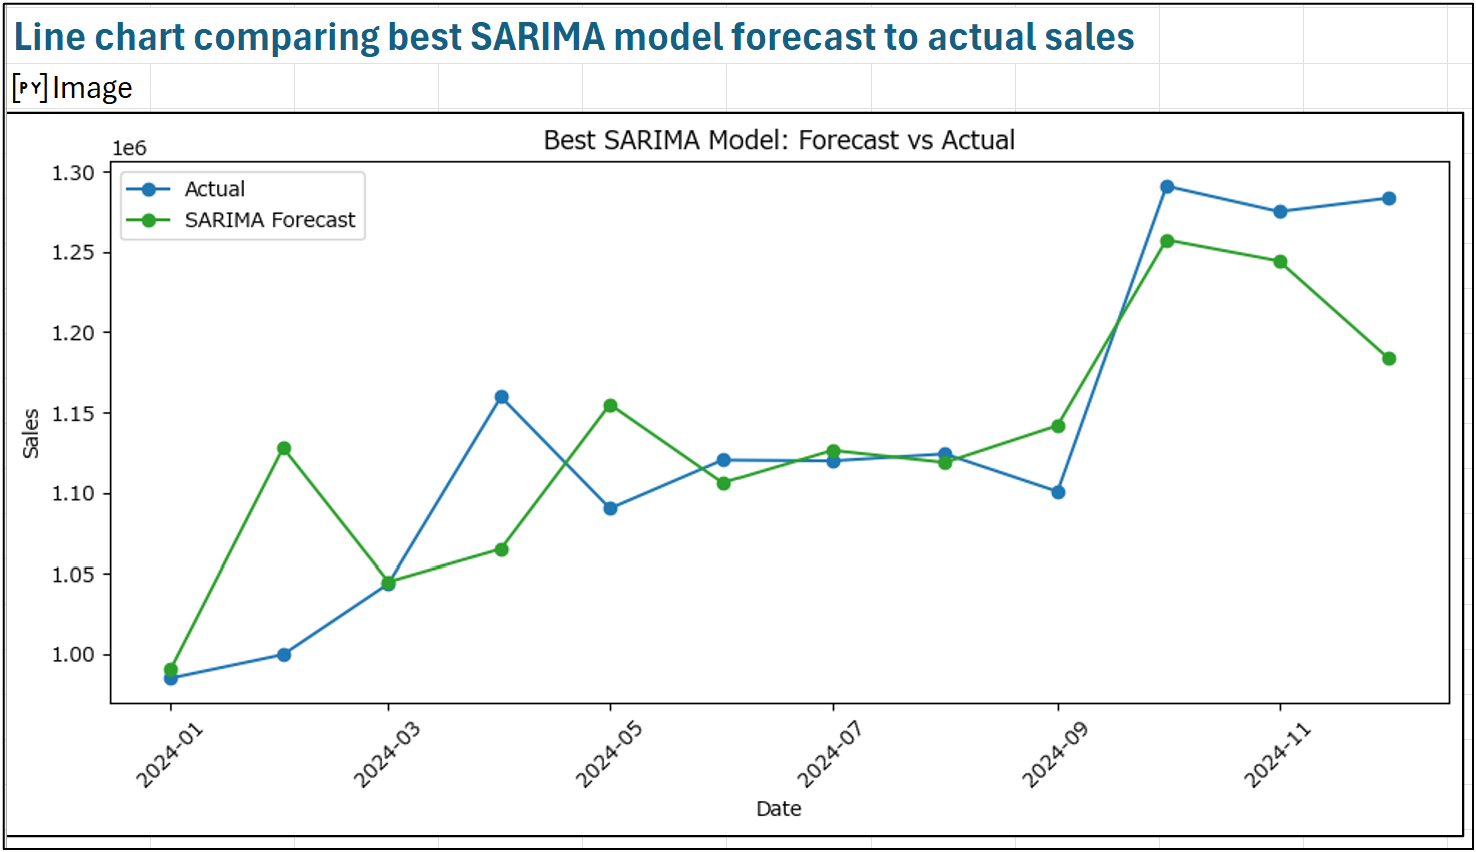
Looking at a line chart of the best SARIMA model will be informative. Here's the prompt:
Create a line chart that compares the forecasts of the best SARIMA model to the actual values from the test data.
And the Copilot output:
While this tutorial has focused on partnering with Copilot in Excel to build better forecasting models, the uses for the combination of Copilot and Python in Excel don't stop with forecasting.
With the right Python analytics skills, you can also partner with Copilot in Excel to perform the following using powerful machine learning techniques:
Customer segmentation
Churn prediction
Fraud detection
Lead scoring
And the list goes on and on!
This Week’s Book
When building data-driven forecasts, it's common to pull the data you need from various databases within your organization (e.g., a data warehouse). This is where building SQL skills is invaluable, using my favorite SQL book:

NOTE - While the above book focuses on using Microsoft SQL Server, don't let that deter you. First, SQL is a highly transferable skill. Second, Microsoft offers SQL Server for free, allowing you to practice.
That's it for this week.
Next week's newsletter will begin a new tutorial series on ARIMA forecasting models.
Stay healthy and happy data sleuthing!

Dave Langer
Whenever you're ready, here are 3 ways I can help you:
1 - The future of Microsoft Excel forecasting is unleashing the power of machine learning using Python in Excel. Do you want to be part of the future? Order my book on Amazon.
2 - Are you new to data analysis? My Visual Analysis with Python online course will teach you the fundamentals you need - fast. No complex math required, and Copilot in Excel AI prompts are included!
3 - Cluster Analysis with Python: Most of the world's data is unlabeled and can't be used for predictive models. This is where my self-paced online course teaches you how to extract insights from your unlabeled data. Copilot in Excel AI prompts are included!