
Join 1,000s of professionals who are building real-world skills for better forecasts with Microsoft Excel.
Issue #38 - Forecasting with Excel Part 1:
The Fundamentals
This Week’s Tutorial
This week's tutorial starts off with fundamental concepts in forecasting. This tutorial is designed for any professional.
The goal is to provide an intuitive introduction to data-driven forecasting using Excel. Therefore, I will limit the math coverage.
However, what you will learn is legit techniques for creating data-driven forecasts using native Excel features.
If you would like to follow along with today's tutorial (highly recommended), you will need to download the SalesTimeSeries.xlsx file from the newsletter's GitHub repository.
What is Forecasting?
Here's a definition of forecasting from wikipedia:
“Forecasting is the process of making predictions based on past and present data. Later, these can be compared with what actually happens.”
Based on this definition, you would be right to think that any form of predictive analytics is the same as forecasting.
However, the common interpretation of forecasting means creating predictions from time series data.
You can think of this time series data as being like a crystal ball that allows you to predict what’s going to happen in the future.
For example, predicting monthly sales for the next twelve months using historical data.
Time series forecasting is a universal skill. Here are some examples from various industries and business functions:
[Supply Chain] - Forecasting product demand.
[Customer Service] - Forecasting call volume.
[Healthcare] - Forecasting hospital supplies.
[IT] - Forecasting server/cloud usage.
[Finance] - Forecasting revenue.
And the list goes on!
What you will learn in this tutorial series is skills that can be applied to any forecasting problem, regardless of domain.
Therefore, the exact nature of the dataset used in the tutorial series doesn't matter.
What is a Time Series?
For these tutorials, a time series will be defined as a set of measurements collected at regular time intervals.
These measurements can include anything, such as sales, demand, advertising spend, claims, etc.
The combination of measurement and regular time interval will be referred to as the grain of the data.
Consider the following snippet of data from the Sales worksheet of the tutorial Excel workbook:
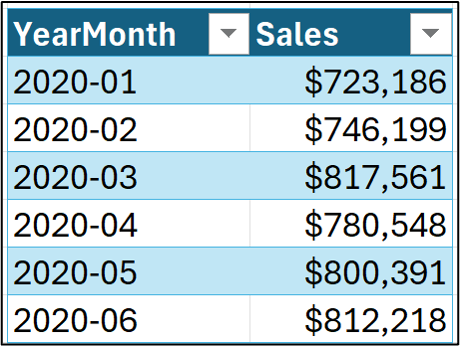
This is a time series dataset at the grain of sales per month.
Most classic (i.e., statistical) time series forecasting techniques work with a single measurement at a time, like the time series pictured above.
However, a time series can also include additional data. For example:
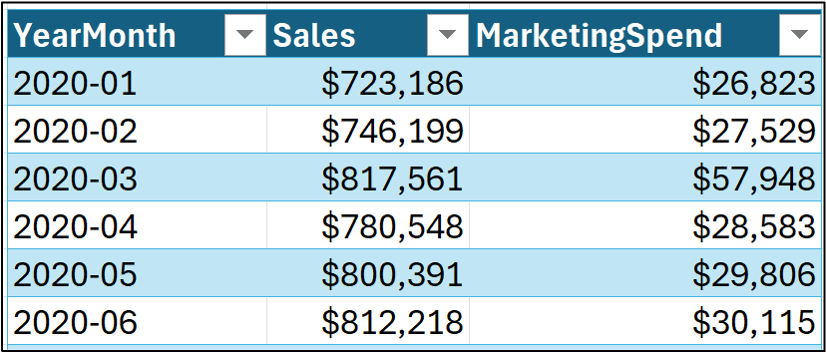
In 2025, state-of-the-art forecasting (e.g., using machine learning) leverages many types of additional data (e.g., promotions, weather, planned expansions, etc.) to improve forecasting.
For example, in the image above, incorporating MarketingSpend data might produce better forecasts than just using Sales data alone.
To keep all of this data straight, I'm going to use the following terminology in this tutorial series:
Timestamps denote the time period for which the data is applicable. In the image above, YearMonth is the data's timestamp.
Targets are the measurement values to be forecasted. In the image above, the Sales column contains the targets.
Features are additional measurements/data that can be used to improve target forecasts. In the example above, MarketingSpend is a feature.
Time Series Forecasting Models
To craft data-driven forecasts we use models. Just in case you're new to the concept of a model, here's a definition from wikipedia:
“A model is an informative representation of an object, person, or system.”
This definition is great for this tutorial series, because we're looking to build an informative representation of the system that produces the targets (e.g., sales).
Notice how the definition uses informative and not definitive?
This is a critical idea embodied by the following famous quote from George Box:
"All models are wrong, but some models are useful."
Make no mistake. Your forecasting models will always be wrong to some degree.
The question isn't whether your forecasting model is correct, it's whether your forecasting model produces "good enough" predictions so that effective decisions can be made.
Time Series Characteristics
When thinking about what makes a good forecasting model, we can decompose target values over time into three characteristics:
Trend is the tendency for target values to increase/decrease over time.
Seasonality are patterns in the targets that appear in regular intervals (e.g., higher retail sales starting with "Black Friday" each year).
The remainder is what is left over from the target values once trend and seasonality is accounted for (i.e., removed from the original target values).
Before I discuss the first two in the context of the tutorial time series, I want to provide some additional context for the remainder.
The remainder is also known by other names:
Residual
Noise
Error
Think of the remainder of a time series as being the result of your model being wrong to some degree (i.e., if you're model's forecasts were perfect, there wouldn't be any remainder).
OK. The easiest way to build an intuition about trend and seasonality is to use a data visualization.
In the tutorial Excel workbook, select the Sales worksheet and click on any cell within the table:
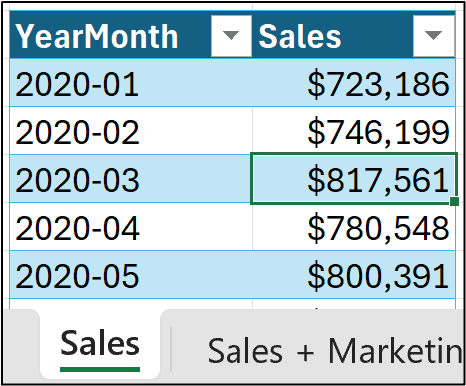
Now, use the Ribbon to insert a mighty line chart:

First up, the line chart gives us a strong indication that there is a trend in the time series:
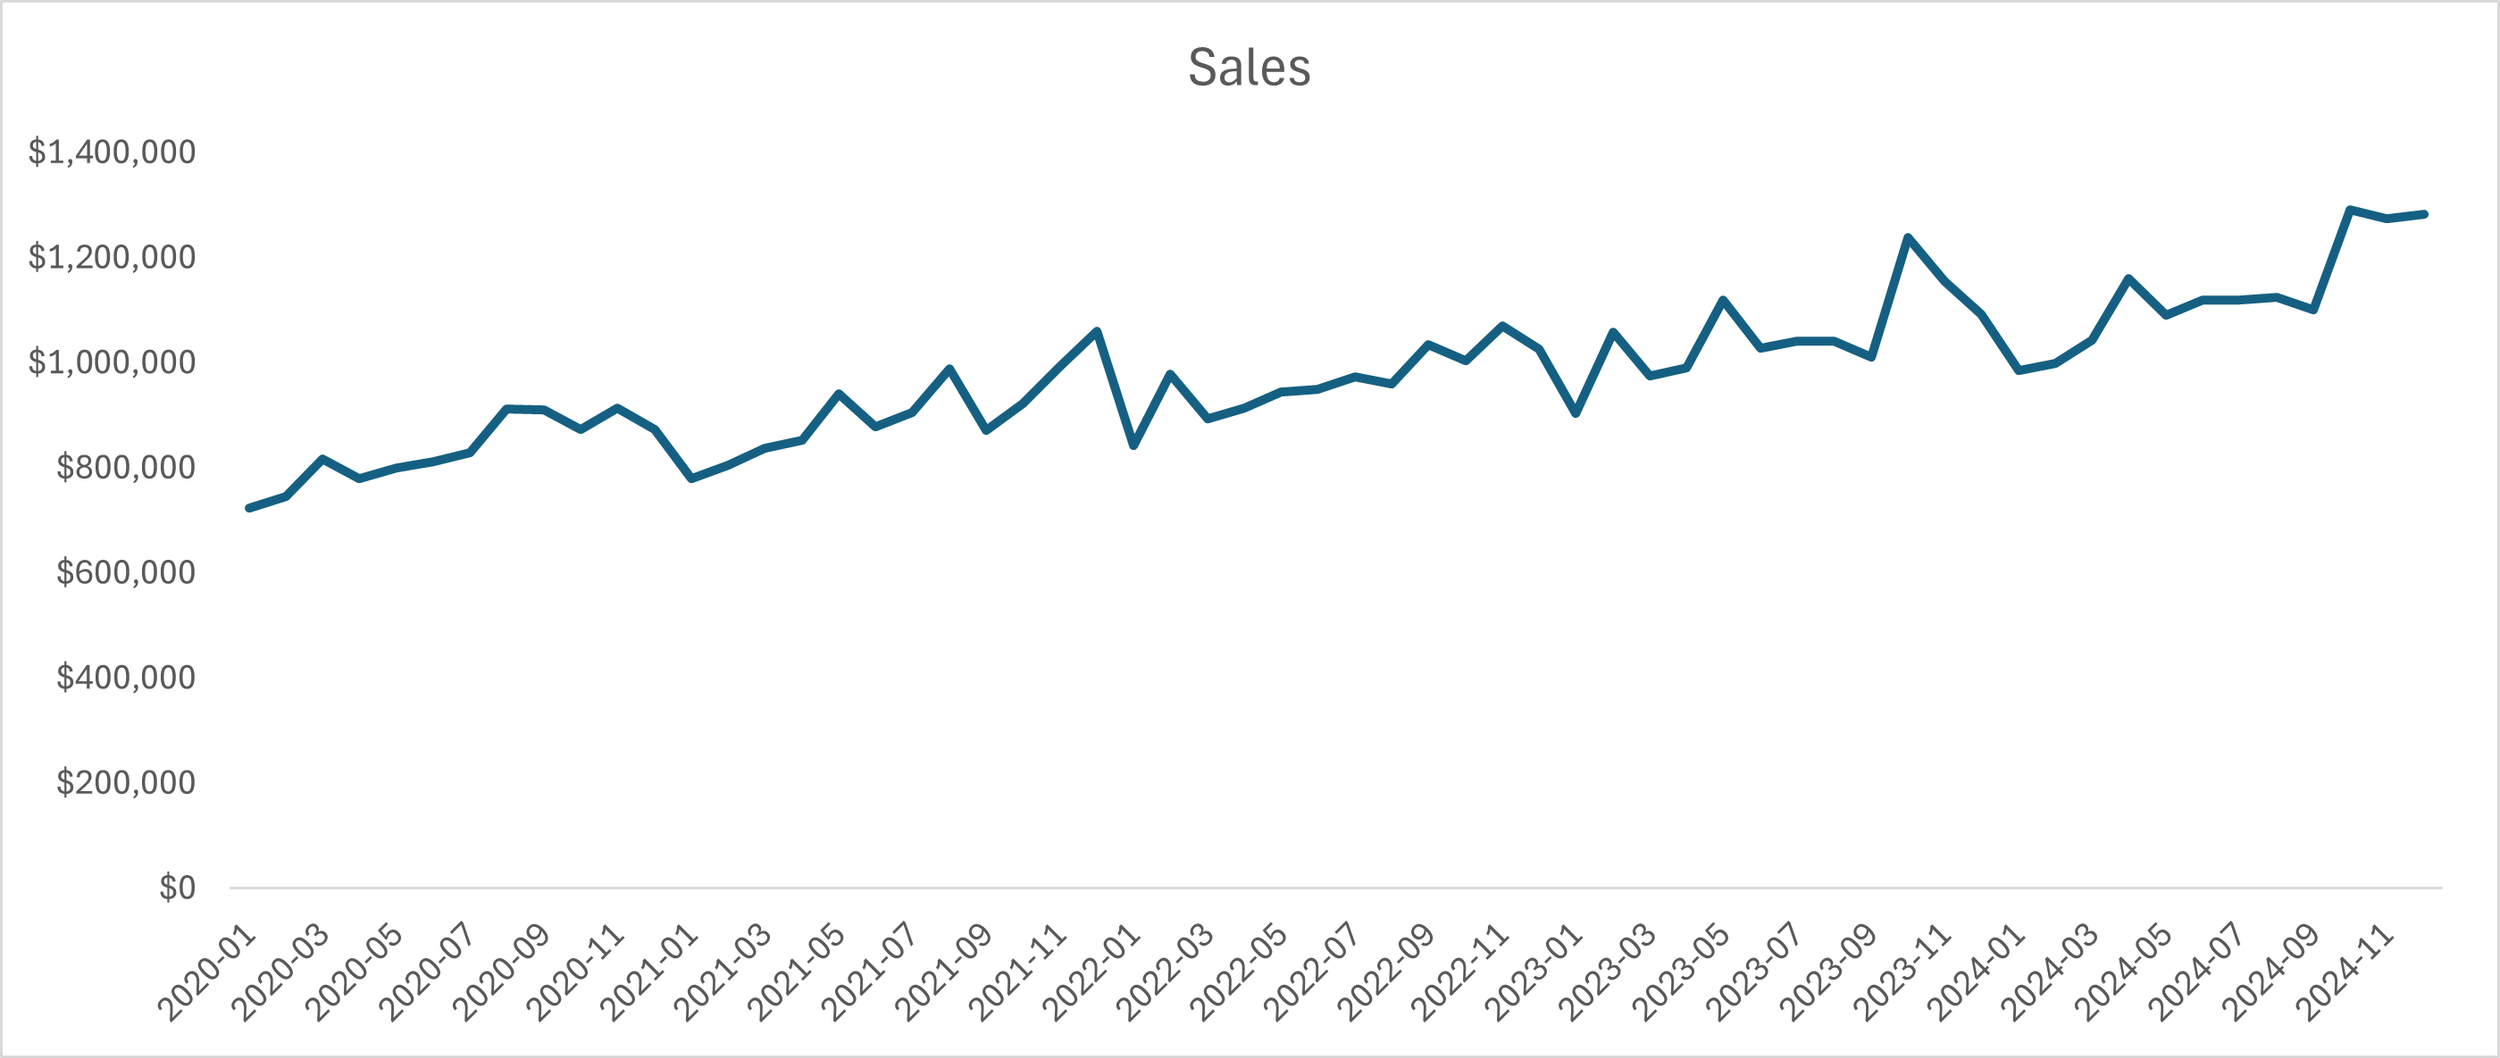
Seasonality is a bit more challenging to spot, requiring hovering over the various data points in the line chart and checking the values:
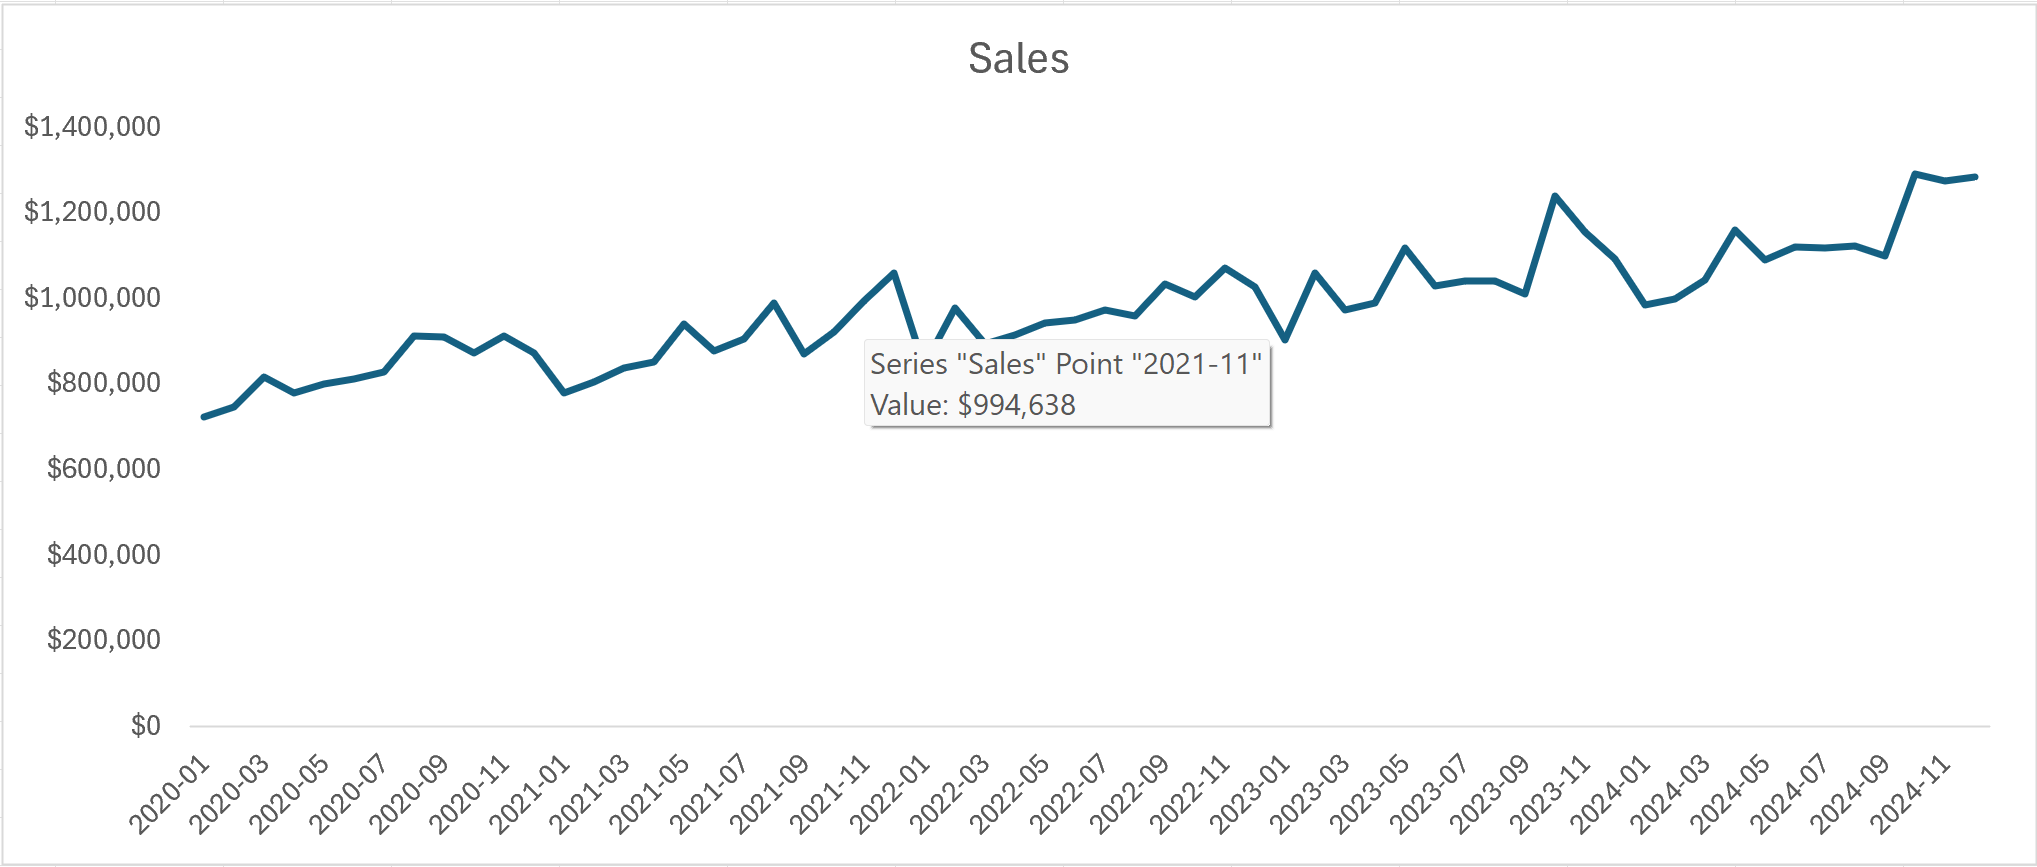
If you inspect the data points, there are typically more sales in the last months of the year compared to the other months.
As with so many real-world situations, this is not a cut-and-dried pattern in the data.
Using the tutorial's time series as a frame of reference, a useful forecasting model will need to accurately predict both the upward trend and the apparent seasonality in the data.
While simultaneously minimizing the remainder as much as possible.
This Week’s Book
Forecasting is a critical skill for any organization that relies on a supply chain to conduct it's operations. This is an excellent book on understanding how to improve forecasting supply chain demand:

While most people automatically think of manufacturing and retail organizations when it comes to supply chain forecasting, the COVID pandemic demonstrated that many types of organizations (e.g., healthcare) can benefit from improved supply chain forecasting.
That's it for this week.
Next week's newsletter will cover more robust techniques for characterizing trend and seasonality by introducing simple models.
Stay healthy and happy data sleuthing!

Dave Langer
Whenever you're ready, here are 3 ways I can help you:
1 - The future of Microsoft Excel forecasting is unleashing the power of machine learning using Python in Excel. Do you want to be part of the future? Order my book on Amazon.
2 - Are you new to data analysis? My Visual Analysis with Python online course will teach you the fundamentals you need - fast. No complex math required, and Copilot in Excel AI prompts are included!
3 - Cluster Analysis with Python: Most of the world's data is unlabeled and can't be used for predictive models. This is where my self-paced online course teaches you how to extract insights from your unlabeled data. Copilot in Excel AI prompts are included!