
Join 1,000s of professionals who are building real-world skills for better forecasts with Microsoft Excel.
Issue #31 - Market Basket Analysis Part 6:
AI Prompts
This Week’s Tutorial
This week's tutorial will conclude the series on market basket analysis (MBA).
If you're new to the newsletter and need to catch up, check out Parts 1-5 of this tutorial series via the newsletter back issues.
Today's tutorial will demonstrate how to use Copilot in Excel to conduct an MBA.
In particular, you will learn that the key to using AI effectively is having the knowledge to:
Craft effective prompts.
Validate Copilot's output.
Re-prompt the AI as needed.
If you would like to follow along (highly recommended), be sure to download the MarketBasketPurchases.xlsx file from the newsletter's GitHub repository.
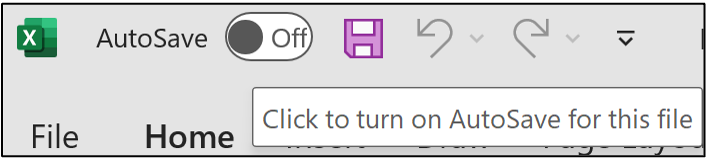
At the time of this writing, you must store your Excel workbook in a Microsoft cloud service (e.g., OneDrive) to use Copilot in Excel. Simply flip AutoSave to on:
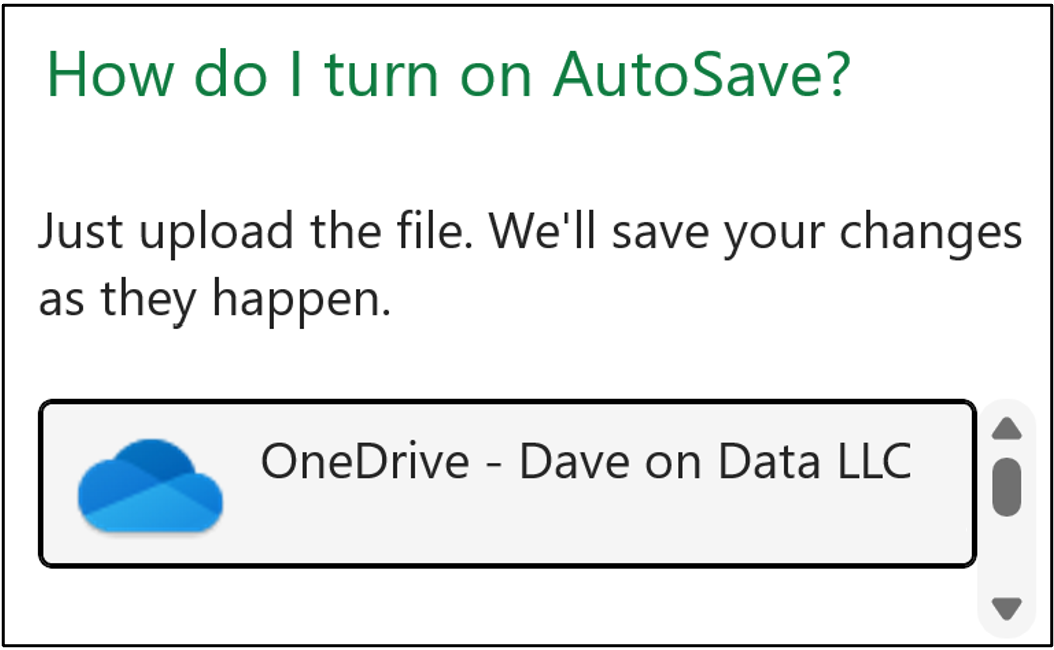
You will then need to select a storage location in the cloud. If you're using a work laptop check with your IT department on what you should use. Here you can see I'm using OneDrive:
Once the workbook is saved to the cloud, it's a good idea to close Excel and then reopen the workbook from the cloud location.
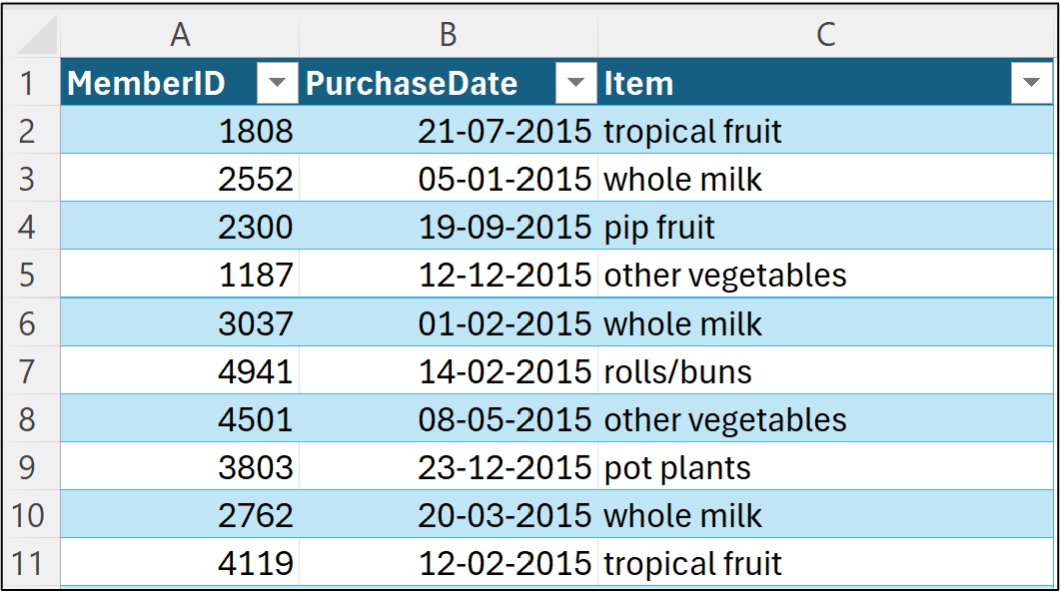
As covered earlier in the tutorial series, the data is organized in a long format:
Copilot in Excel offers an "advanced analysis" mode. In my experience, this is where all the most valuable AI use cases for Excel live.
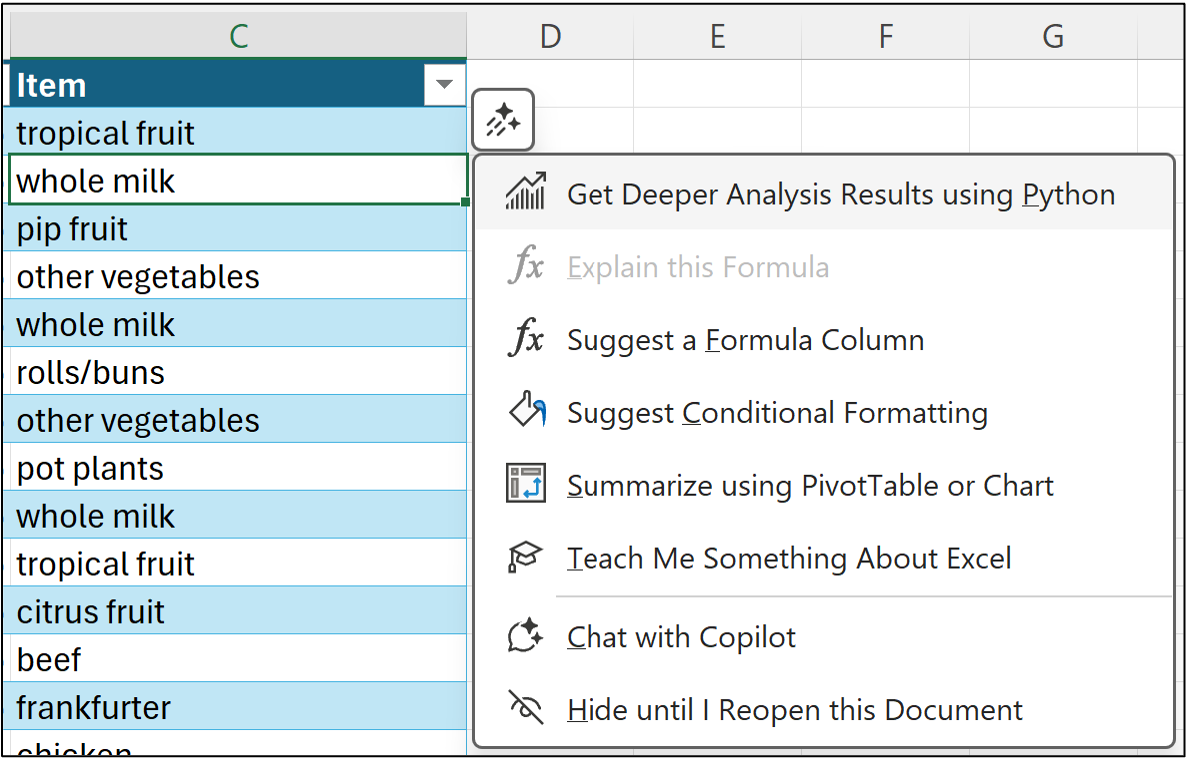
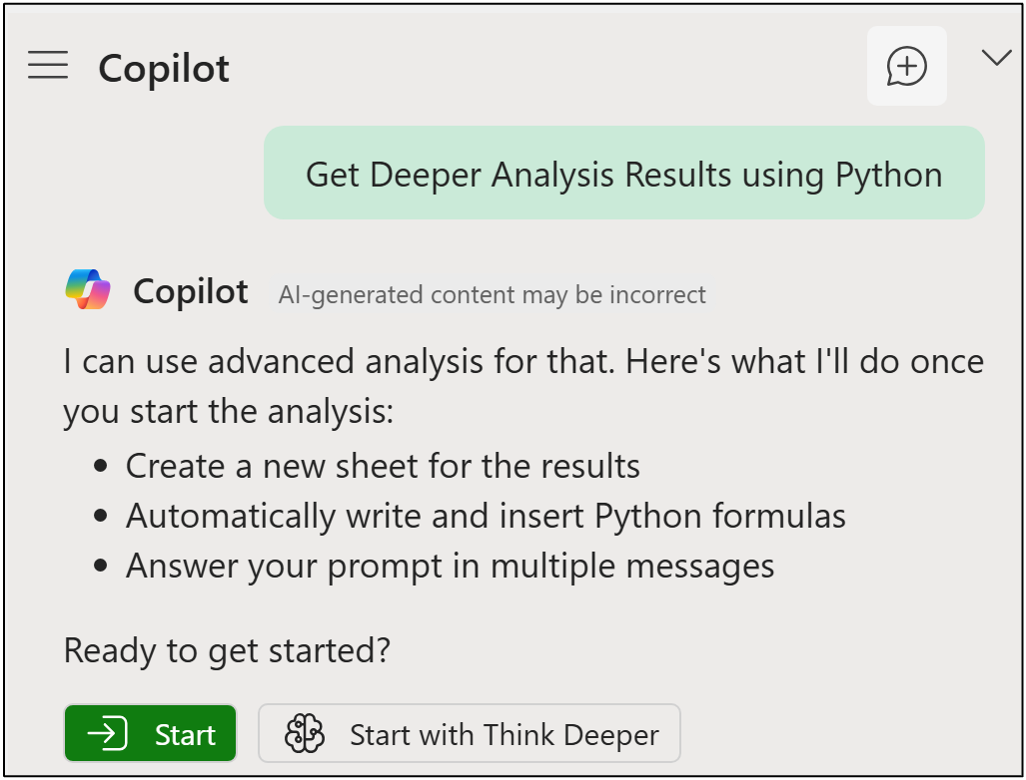
Starting the Copilot mode is easy. Click in a cell in the table and then click the Copilot icon. From the context menu, select Get Deeper Analysis Results using Python:
In response, the Copilot pane will open and ask you to explicitly start the advanced analysis mode. Click the green Start button:
The first thing Copilot will do is create a new worksheet. This worksheet is where Copilot will generate and store the Python in Excel code to conduct the MBA:
Here's what Copilot is doing for your automatically:
Loading the Excel table into Python.
Examining the data to build an "understanding."
Generating a number of first-pass analyses based on Copilot's understanding.
In my experience, Copilot's advanced analysis mode is quite good at building an understanding of the nature of the data.
Not perfect, but quite good.
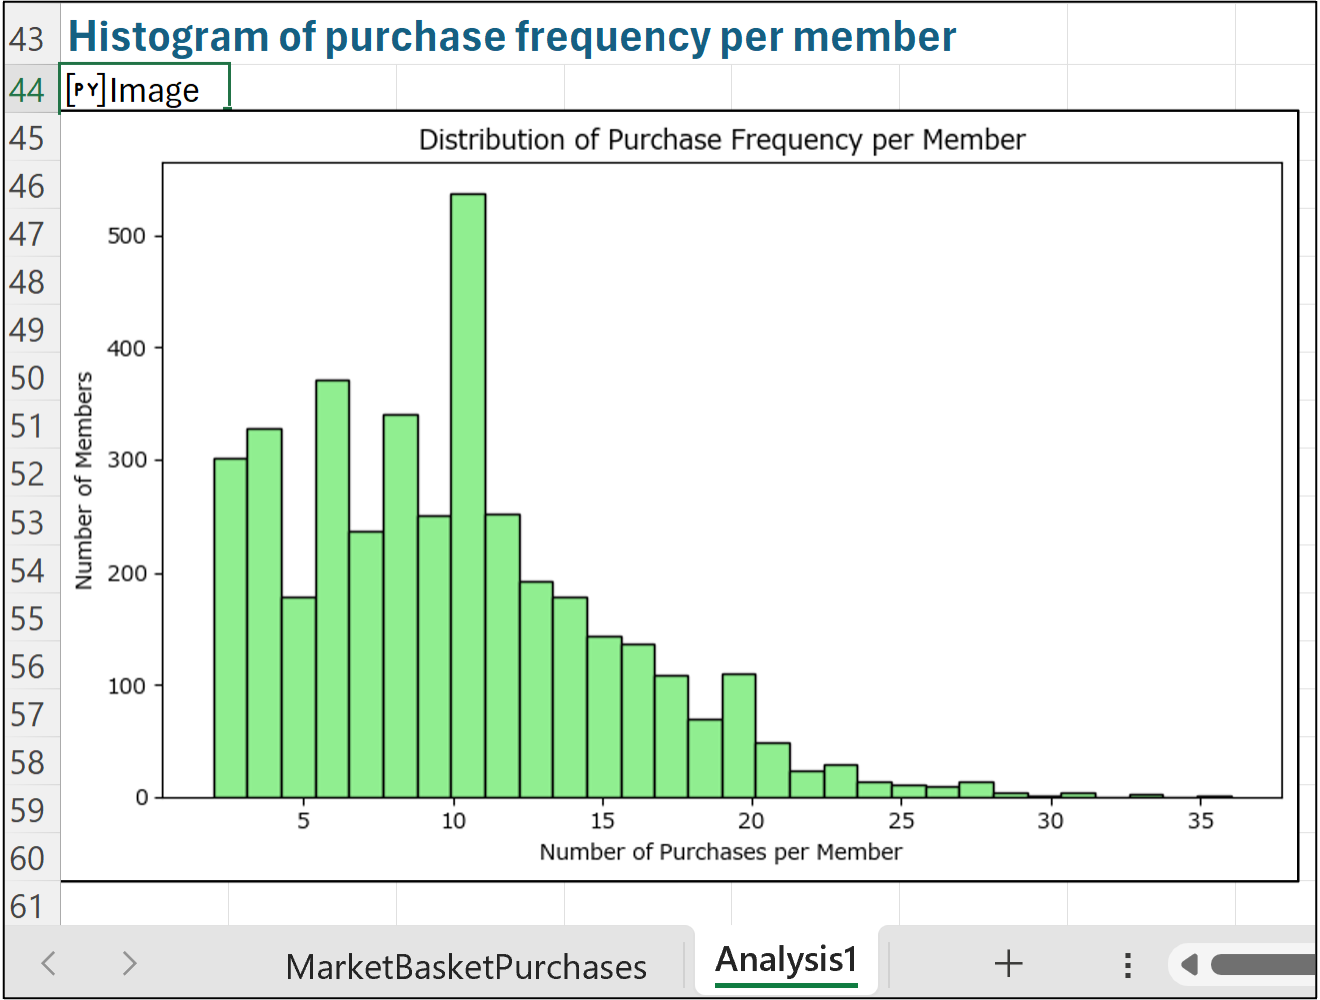
Notice in the above image how Copilot has figured out that the table is transactional data about purchases and created a histogram to visually analyze the data.
However, there is a little snag we have to contend with when using the Copilot AI.
You likely won't see the same thing as the image above.
Copilot, like all current AI technologies, isn't guaranteed to always produce the same results from a given prompt.
Think of AI as making educated guesses (i.e., predictions) based on your prompts. Think of these guesses as being the product of all the data used to train the AI.
When Copilot first starts advance analysis mode (i.e., from a prompt), the AI has a large pool of data to guess from. This large pool of data tends to vary the results.
I've tested the prompts in this tutorial many, many times to ensure consistent results.
However, Copilot produced a number of different variations for the first-past analyses.
As you will see, using specific prompts is the key to getting the best, most consistent results from Copilot in Excel (or any AI tool).
Here's an example of a specific prompt to transform the raw data into a format needed for MBA:
I would like to perform a market basket analysis on this data. Each transaction is defined by the unique combination of MemberID and PurchaseDate. Can you format the data as a list of transactions where each transaction is a list of string values for each product purchased?
Submitting this prompt consistently produced the following response from Copilot (again, you might not necessarily see the same thing):
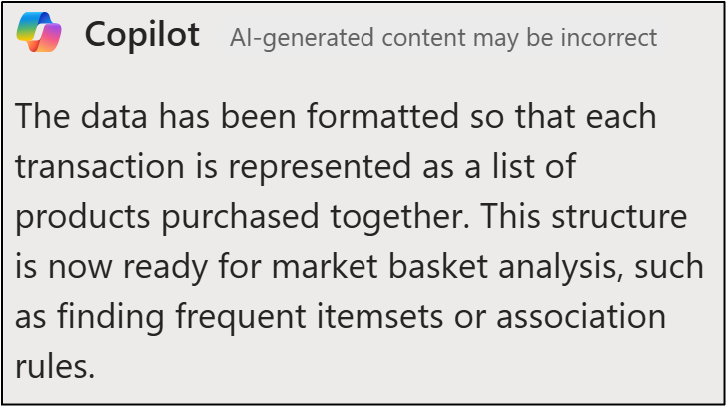
However, what's more important than Copilot's response is the Python code it generated to transform the data. It's always a good idea to validate the code Copilot produces.
This is easy to do using Excel's new Python Editor feature:

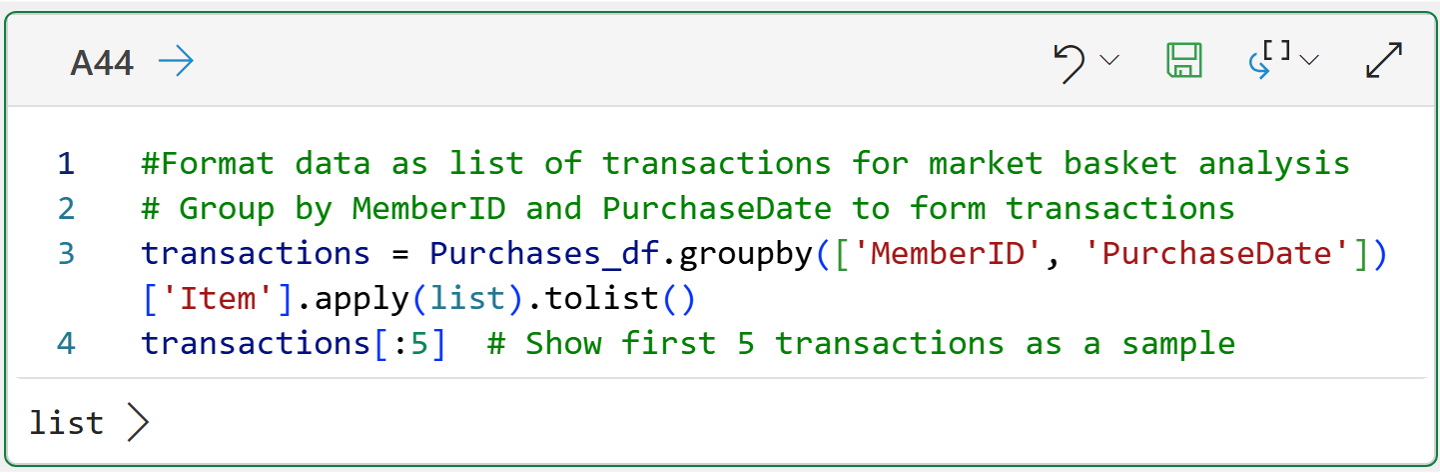
While the above code isn't necessarily the most efficient, it is functionally correct. This is a common pattern I see with Copilot.
As you develop more skills, you can refine your prompts to be more specific and ensure you get the desired results.
As you learned earlier in the tutorial series, the next step in the MBA process is to mine frequent itemsets from the transformed data. Here's a Copilot prompt:
Using the mlxtend library, please mine frequent itemsets from the transformed data. Use a support value of 0.001 and use column names when mining the frequent itemsets.
The following back-and-forth with Copilot illustrates why building your DIY data science skills is critical for success using AI in data analysis (e.g., re-prompting the AI):

BTW - I let Microsoft know that Copilot in Excel should really know which Python libraries are available. 🤣
Setting the above Copilot squabble to the side, notice how the above prompt is very specific? This is another common pattern I see when using Copilot for data analysis.
It's best to frame your prompts in a way where you can easily copy and paste the prompt and tweak aspects of the analysis. In this case, easily tweaking the support threshold.
In my testing, the above prompt produced consistent results in the Python code.
Moving on, the next MBA step is to mine the association rules. Again, using a very specific prompt produces consistent results:
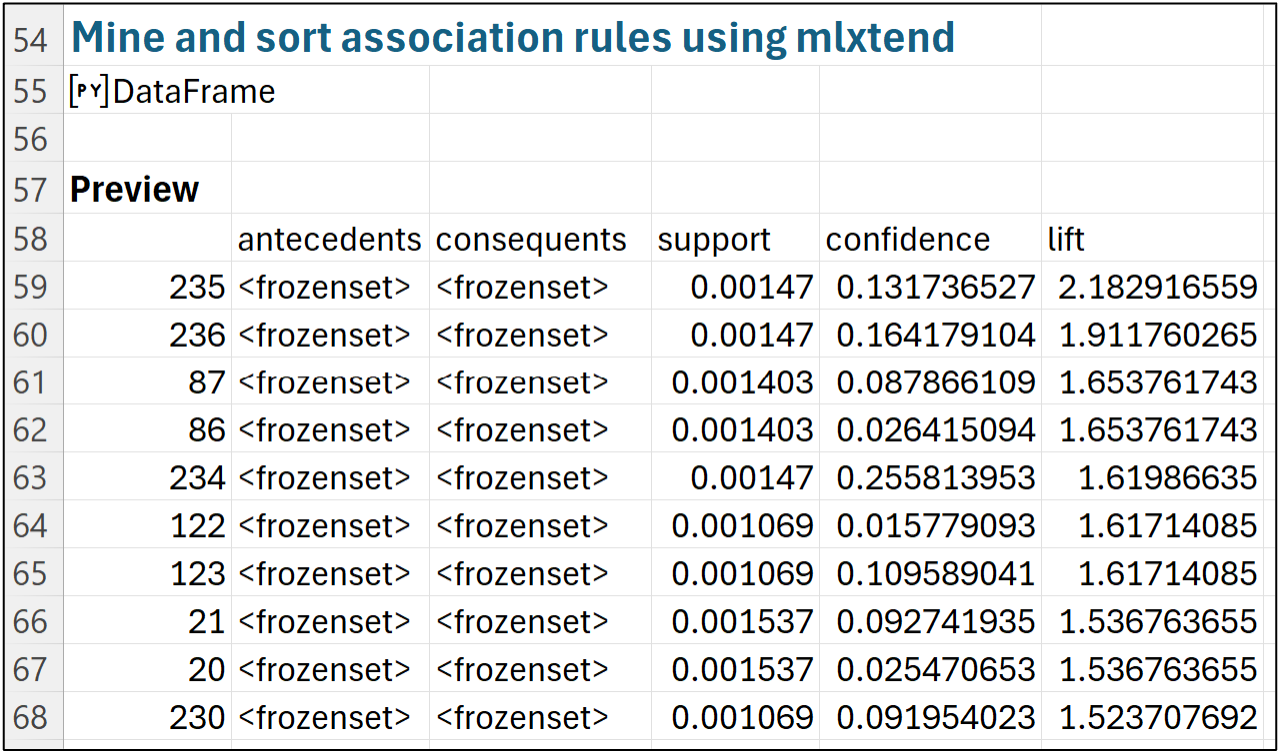
Using the mlxtend library, mine association rules from the frequent itemsets, focusing on the lift metric. Only include mined rules where there is a single consequent. Please sort the mined rules in descending order first by lift, then by confidence, and lastly by support.
This last prompt delivered consistent results in my testing, producing the following output:
Unfortunately, Copilot didn't transform the data to make the antecedents and consequents readable. No worries. Nothing another prompt can't handle:
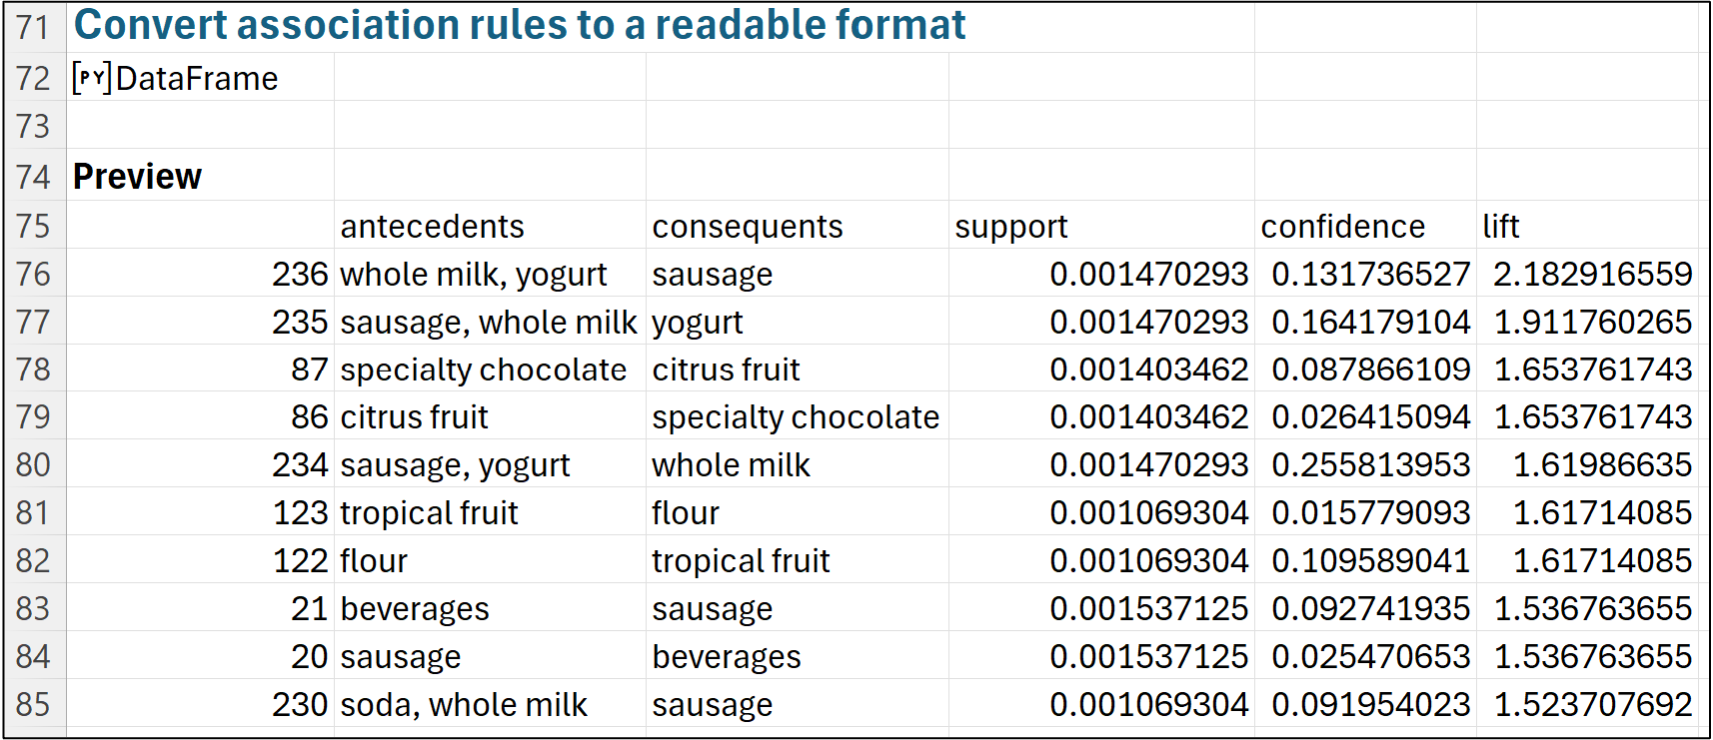
Please convert the association rules into a format that is easily readable.
And the consistent output of this prompt:
And the code that Copilot generated to produce the readable format:

Voila!
Copilot has produced the readable_rules object which you can use in your Python in Excel code if you would like. For example, outputting the entire rules DataFrame to a worksheet for further analysis.
When you have the skills, Copilot in Excel can be an amazing partner to unleash the power of your data.
While this tutorial series has focused on market basket analysis, the patterns of using your analytics knowledge to craft specific prompts extends to more advanced techniques like:
Cluster analysis
Analyzing free-form text
Machine learning predictive models
Professionals who build these skills can demonstrate to managers and stakeholders that they can partner with AI and drive real-world results.
This Week’s Book
Since this is the last tutorial in the series, it seemed fitting to once again recommend my favorite book for learning analytics:

This is a university textbook, but it is very accessible to any professional motivated to learn DIY data science. Not only does it include MBA, but it also covers cluster analysis and machine learning predictive models.
That's it for this week.
Next week's newsletter will start a new tutorial series covering one of the most important topics in DIY data science - boosted decision trees.
Stay healthy and happy data sleuthing!

Dave Langer
Whenever you're ready, here are 3 ways I can help you:
1 - The future of Microsoft Excel forecasting is unleashing the power of machine learning using Python in Excel. Do you want to be part of the future? Order my book on Amazon.
2 - Are you new to data analysis? My Visual Analysis with Python online course will teach you the fundamentals you need - fast. No complex math required, and Copilot in Excel AI prompts are included!
3 - Cluster Analysis with Python: Most of the world's data is unlabeled and can't be used for predictive models. This is where my self-paced online course teaches you how to extract insights from your unlabeled data. Copilot in Excel AI prompts are included!